Looker is a governance layer. It takes business logic someone else defined, in LookML someone else versioned, and enforces it before any question gets answered. That architecture was a genuine step forward from ungoverned BI, but it made analyst team the bottleneck for every new question.
The platforms replacing it fall into three camps. Most are still semantic layer tools, just trying to make metric governance cheaper or faster. A few have replaced the dashboard layer entirely with warehouse-native tools that inherit security at query time. And a small number are doing something different: governance reasoning engines that let business users ask anything within policy boundaries and return answers instead of rejections.
This comparison covers all three. five platforms, five criteria, evaluated on which camp they actually belong to.
TLDR
This blog evaluates Looker alternatives based on the architectural capabilities that determine whether modern analytics platforms work reliably in production environments:
Analytical Depth — The platform's ability to answer complex business questions through multi-step analysis instead of only rendering pre-built dashboards or models.
Data Source Connectivity — Live querying across warehouses, databases, and SaaS platforms without requiring central data movement or proprietary extract layers.
Self-Service Accessibility — How easily business users can explore and analyze data without writing LookML, SQL, or waiting for analysts to model new questions.
Governance and Data Trust — Whether the platform enforces consistent metric definitions, access controls, and traceable query execution across all question types, not just pre-modeled ones.
Operational Cost — The total cost of operating the analytics platform including licensing, infrastructure, compute usage, and the analyst time required to maintain consistency.
The platforms covered are Genloop, Tableau, Microsoft Power BI, Qlik Sense and Hex
Why Looker Deployments Hit Scaling Walls
Looker was designed with a semantic model at its core that lets you define metrics once and use them everywhere, for better governance, security, and overall trust in your data. That strength becomes a bottleneck as organizations grow and question diversity accelerates.
Modeling lag: Looker compiles a shared semantic model into SQL, but metric definitions require code review before any query can execute against them. Organizations with weekly release cycles develop BI backlogs because analysts can't keep up with request volume.
Source plurality: Looker commonly connects to cloud warehouses and databases like Snowflake, BigQuery, Redshift, and other SQL-speaking systems. But connecting new sources requires LookML extensions. Distributed data ownership means distributed model maintenance.
Concurrent governance: Looker's semantic layer provides centralized definitions where experts define metrics, dimensions, and join relationships once to be reused across all Looker Agents, chats and users, ensuring consistent answers. But policy changes require model deployments. Policies that change within a release cycle require custom workarounds.
Vendors built around pre-modeled architectures fail all three. The architectural gap is the same one we covered in our breakdown of why Traditional BI struggles to answer new questions without dashboards.
The Five Platforms
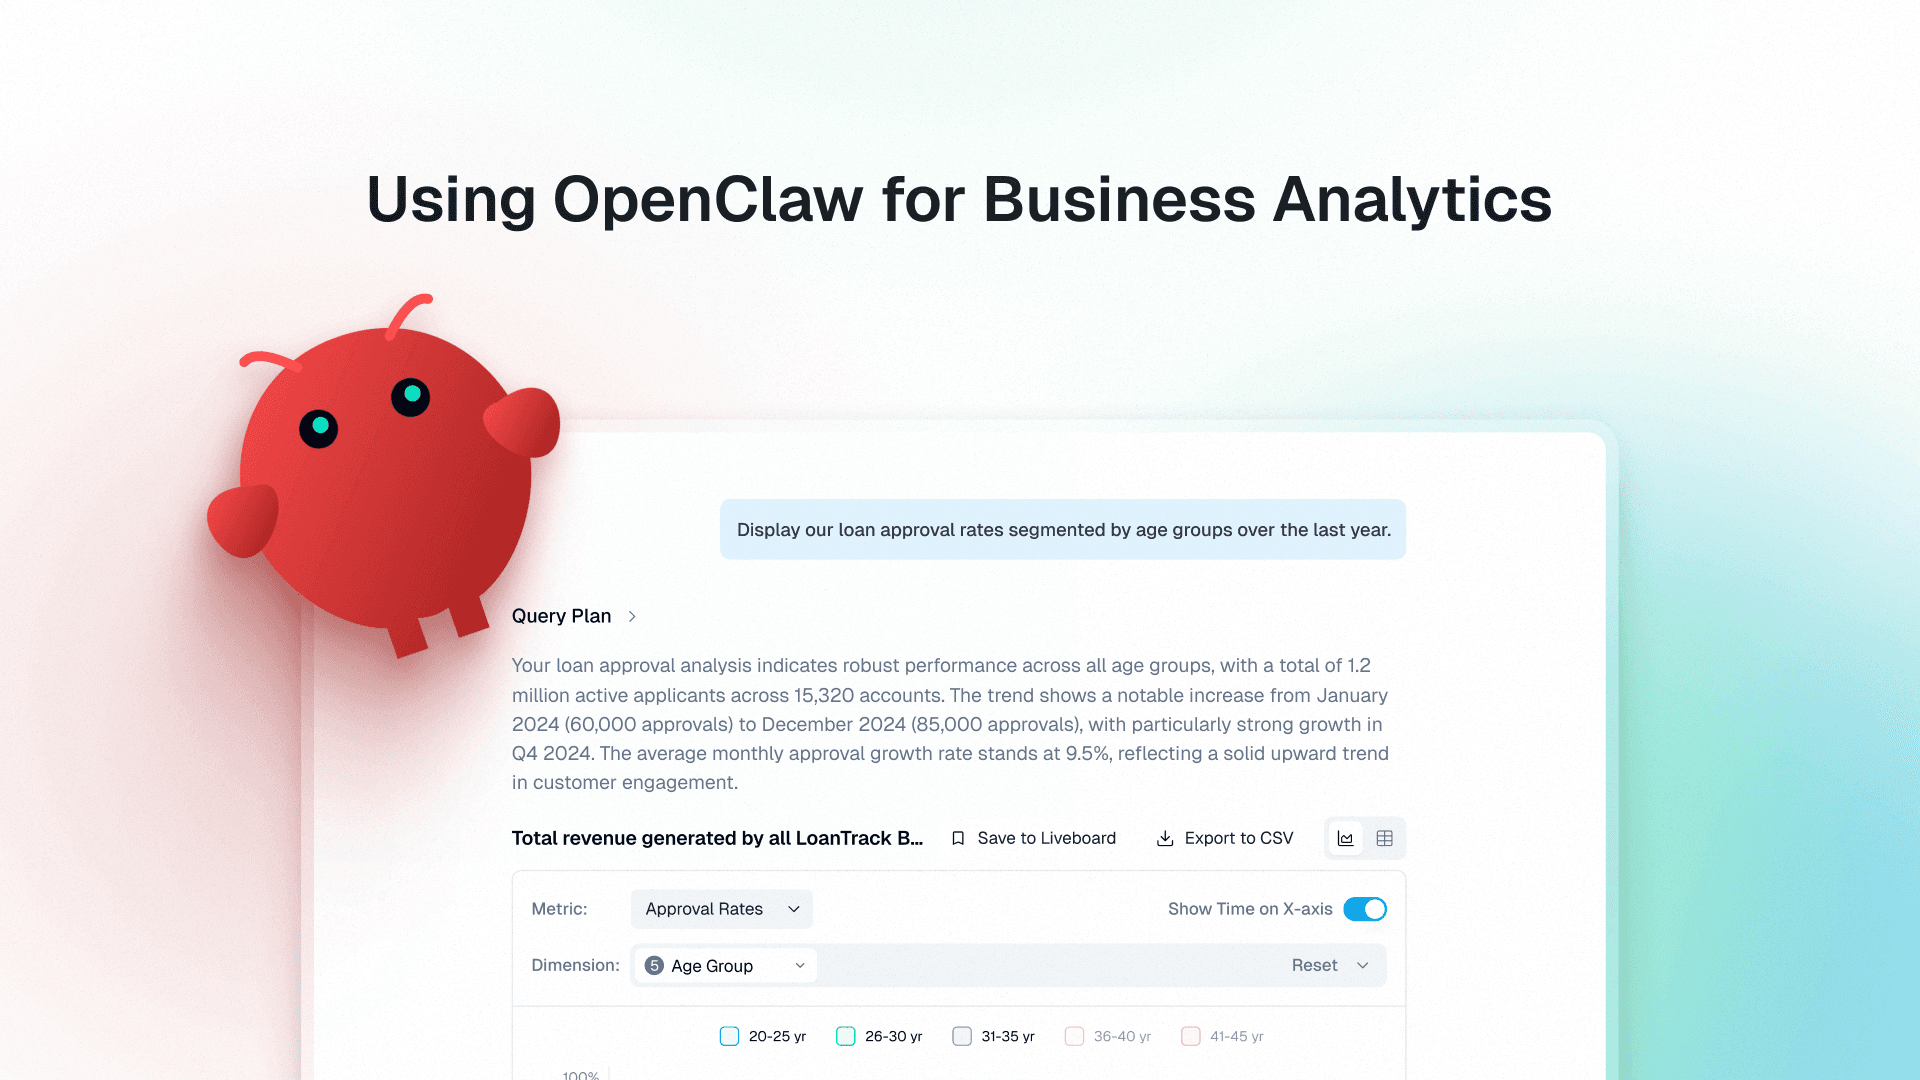
1. Genloop
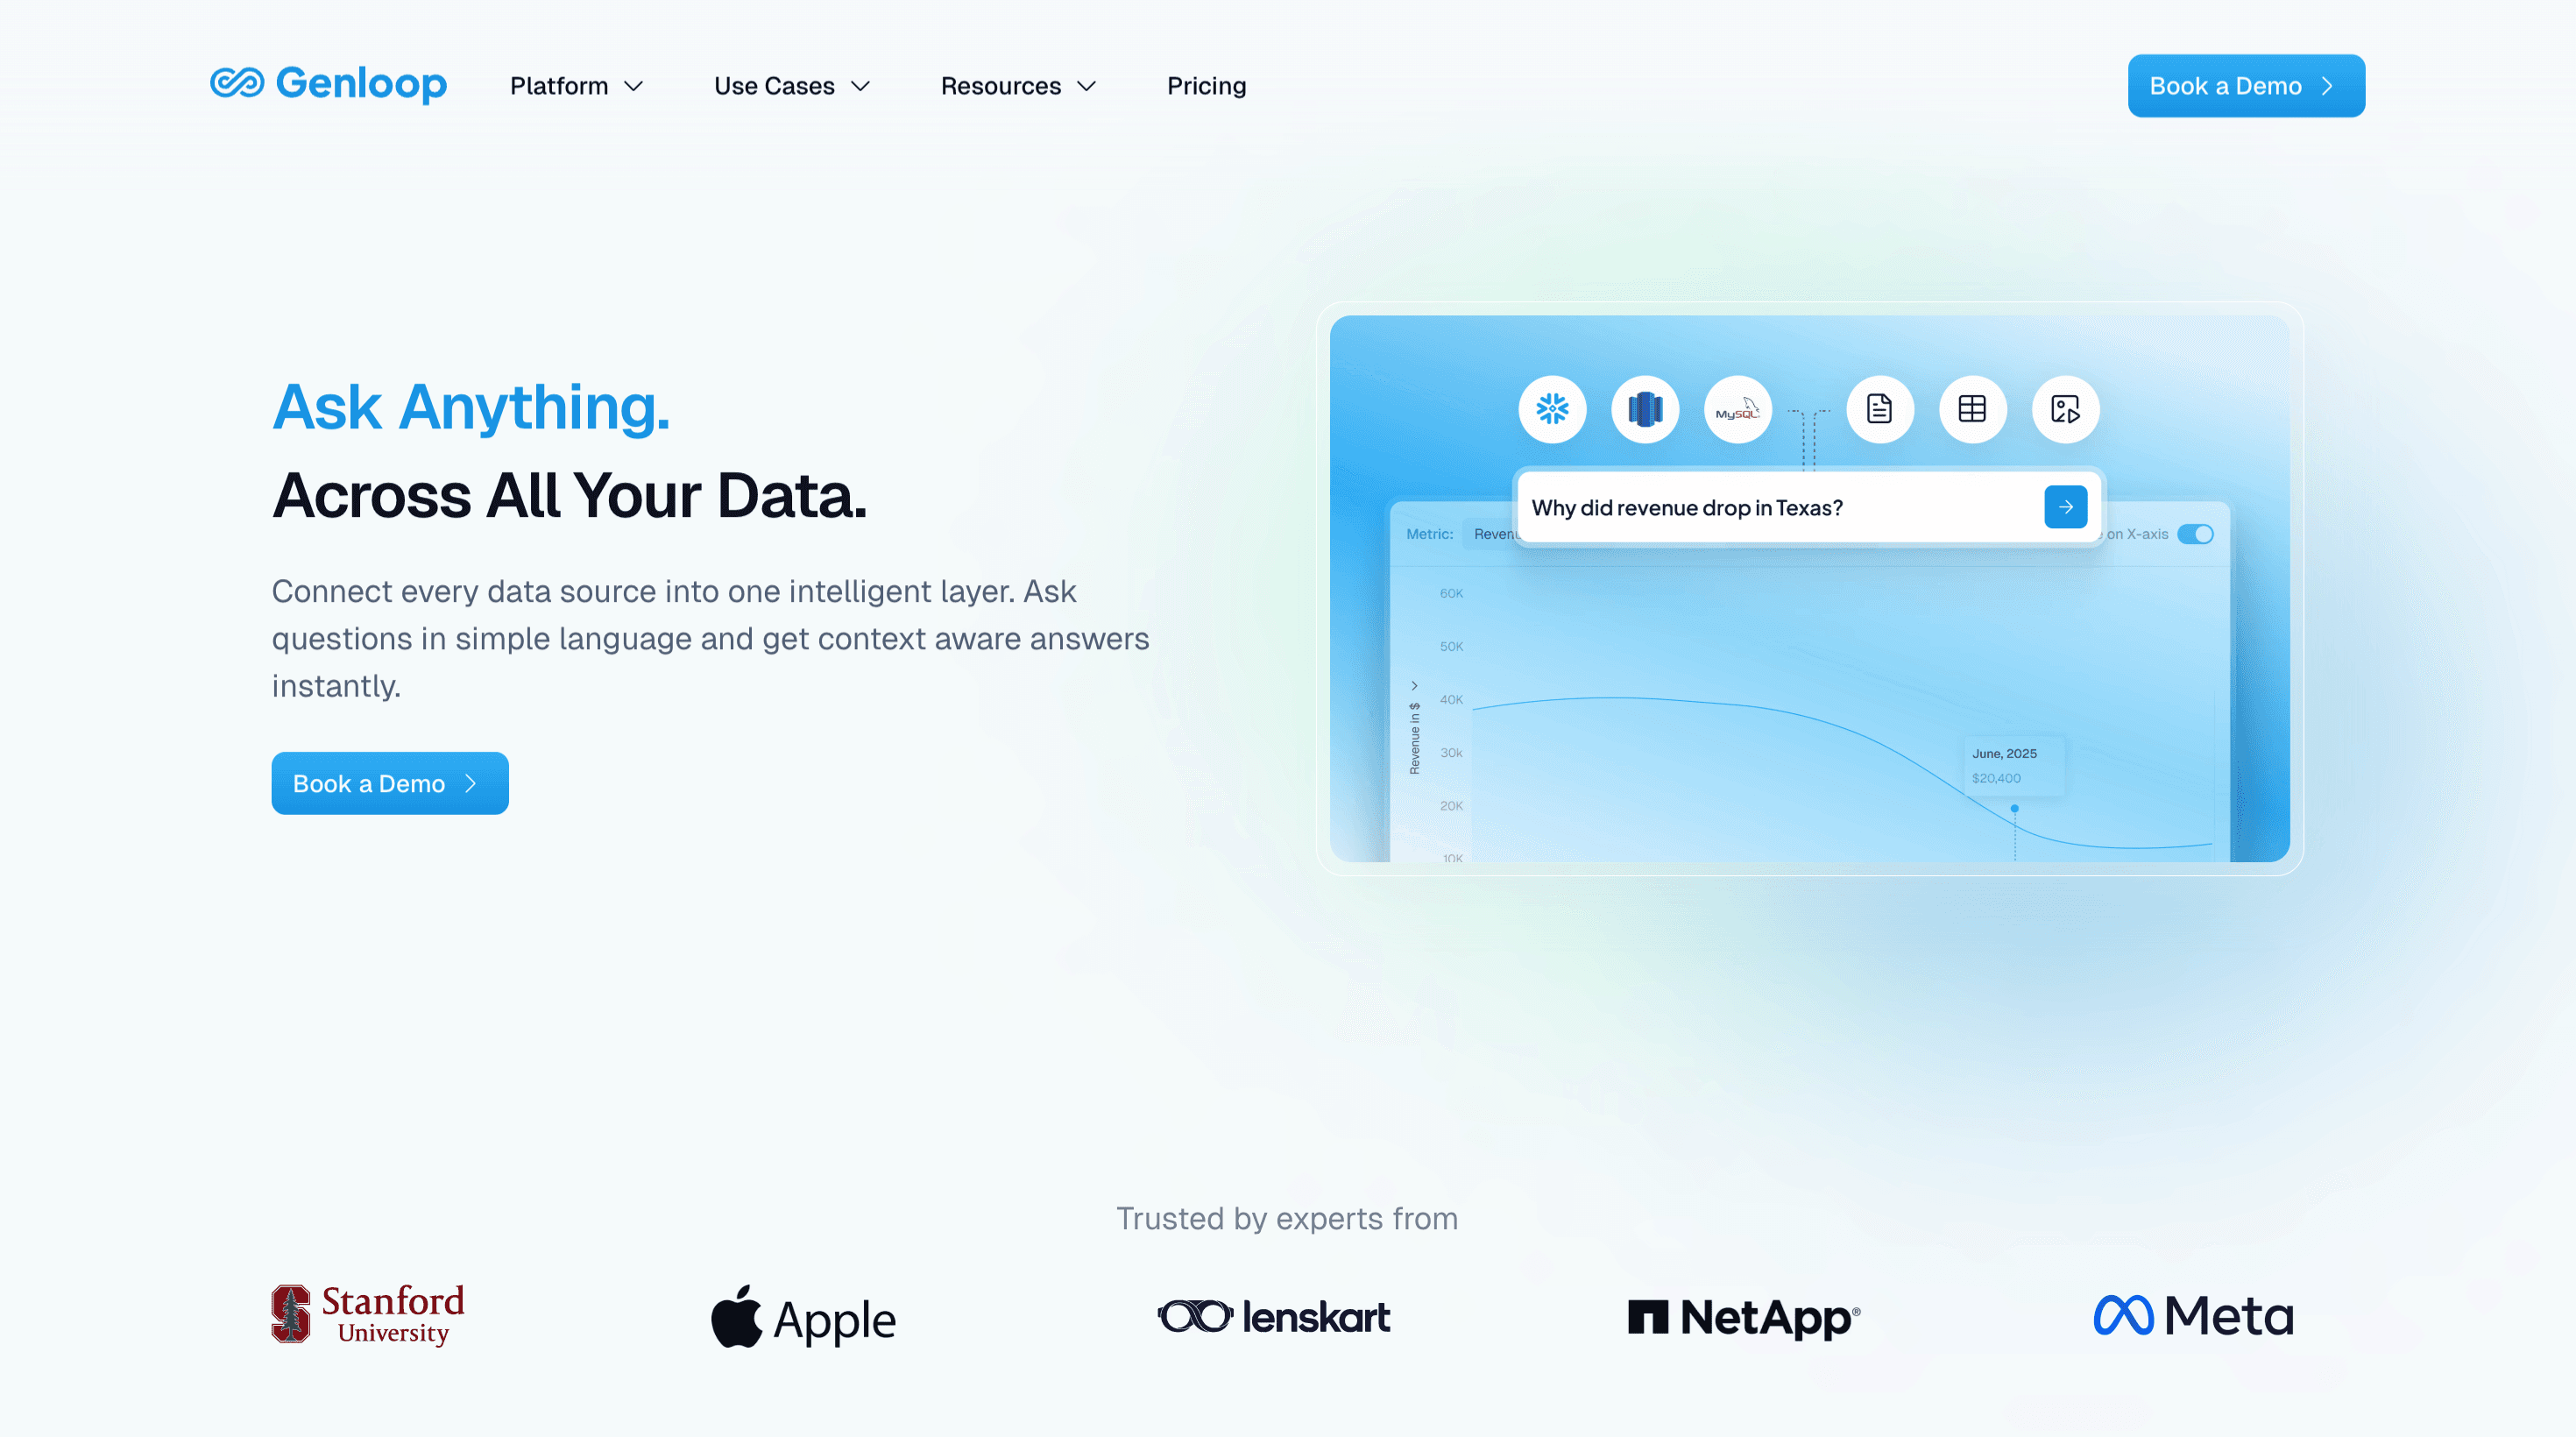
Genloop scores 96.7% on the Spider 2 benchmark, making it the most accurate data reasoning platform available. Where Looker stores metric definitions in LookML code, Genloop builds a Unified Business Memory layer that captures metric definitions, business logic, team context, and join logic as executable governed semantics. Business users ask questions in plain English. Genloop reasons through them, validates against the Unified Business Memory, and returns governed answers without analysts building LookML for every new question pattern.
The BI reporting backlog doesn't migrate from Looker to Genloop. It stops.
Dimension | Genloop Capability |
|---|---|
Analytical Depth | Answers complex, multi-step business questions through specialized reasoning agents. Supports prescriptive analysis and decision automation, not just visualization of pre-built metrics. Designed to handle long-tail questions that break traditional platforms. |
Data Source Connectivity | Connects directly to Snowflake, BigQuery, Redshift, PostgreSQL, MySQL, and SQL Server. Queries live sources without requiring data movement or proprietary extract layers. Multi-modal context graph maps relationships across all connected sources automatically. |
Self-Service Accessibility | Plain English is the primary interface. Business users ask questions and get governed answers without writing LookML, SQL, or waiting for analysts to extend the model. Reliability engine flags uncertain answers before surfacing them. |
Governance and Data Trust | Every query executes against the Unified Business Memory layer, which enforces metric definitions, RBAC, and row-level and column-level security natively. |
Operational Cost | Distilled task-specific models keep per-question compute predictable at scale. No central data warehouse overhead. No analyst time spent coding LookML definitions. Token economics optimized for high-volume enterprise usage. |
2. Tableau
Tableau is a widely used analytics platform that enables organizations to explore data through interactive dashboards and visual analysis. It connects to a wide range of data sources and allows users to build reports through a drag-and-drop interface while supporting both live queries and extracted datasets. Tableau also includes a semantic layer and governance features that help standardize business definitions, while Tableau Next introduces an agentic analytics layer and workflow capabilities that connect insights directly to action within the Salesforce ecosystem.
Dimension | Tableau |
|---|---|
Analytical Depth | Tableau focuses on visual analytics and dashboard exploration. Advanced analytical workflows often depend on calculated fields or datasets prepared by analysts rather than automated multi-step analysis. |
Data Source Connectivity | Tableau connects to a wide range of data sources including databases, cloud warehouses, files, and many SaaS platforms through live connections or extract-based models. |
Self-Service Accessibility | Business users can explore data through a drag-and-drop interface and dashboards, but underlying datasets and data models are commonly prepared and maintained by analysts. |
Governance and Data Trust | Governance is managed through Tableau Server or Tableau Cloud with role-based permissions, certified data sources, and centralized dataset management. |
Operational Cost | Tableau uses a subscription model with Creator, Explorer, and Viewer licenses, and overall cost increases as organizations scale user access across teams. |
3. Power BI
Power BI is a widely adopted business intelligence platform used by millions of users to turn data into decisions. It combines data connectivity, modeling, and visualization to help organizations explore and share insights across teams. Semantic models capture the definitions that businesses run on, the measures people trust, the relationships that provide context, and the governance that keeps answers consistent. Tabular Model Definition Language (TMDL) brings a code-first semantic modeling experience directly to the browser, enabling greater transparency, efficiency, automation, and more consistent model development.
Dimension | Microsoft Power BI |
|---|---|
Analytical Depth | Power BI supports dashboards, reporting, and modeling through semantic models and DAX calculations. More advanced or complex analysis often requires analysts to build and maintain these models, which can limit fully automated analytical workflows. |
Data Source Connectivity | Power BI provides a broad ecosystem of connectors for databases, cloud warehouses, files, and SaaS platforms, allowing organizations to integrate data from many enterprise systems. |
Self-Service Accessibility | Business users can explore dashboards and reports through the interface, but underlying datasets, transformations, and semantic models are typically prepared and maintained by analysts. |
Governance and Data Trust | Governance is implemented through workspace permissions, dataset certification, row-level security, and integrations with Microsoft governance tools such as Microsoft Purview. |
Operational Cost | Power BI offers relatively low entry pricing with per-user licenses, but enterprise deployments often require Premium capacity or Fabric infrastructure, increasing operational costs at scale. |
4. Qlik Sense
Qlik's one-of-a-kind associative analytics engine brings unmatched power to explore your data and uncover insights. Make selections freely in all objects, in any direction, to refine context and make discoveries. Qlik brings agentic analytics to general availability through Qlik Answers, as well as an MCP server enabling secure access for third-party assistants.
Dimension | Qlik Sense |
|---|---|
Analytical Depth | Qlik Sense enables interactive exploration through its associative analytics engine, but analytical depth often depends on how data models are prepared and structured by analysts. |
Data Source Connectivity | Qlik Sense connects to databases, files, APIs, and cloud warehouses, but many deployments load and transform data into the Qlik engine rather than querying sources live, which can limit direct cross-system analysis. |
Self-Service Accessibility | Business users can explore dashboards and analytics apps once data models are prepared, while analysts typically manage the underlying data transformations and structures. |
Governance and Data Trust | Qlik provides role-based permissions and centralized app management, but governance consistency often depends on how individual apps and datasets are managed across the organization. |
Operational Cost | Operational cost depends on licensing, infrastructure requirements, and the data preparation workflows needed to load and maintain datasets in the Qlik environment. |
5. Hex
Hex is a collaborative analytics platform designed for teams that combine SQL, Python, and interactive data exploration in a single workspace. It enables analysts and data scientists to query data, build models, and create shareable dashboards or data applications that business teams can interact with. Hex connects directly to modern cloud data warehouses such as Snowflake, BigQuery, and Redshift, allowing teams to work with live data while keeping most governance and security controls within the underlying data platform.
Dimension | Hex |
|---|---|
Analytical Depth | Hex supports advanced analysis through SQL queries, Python notebooks, and statistical libraries. Analysts can perform exploratory analysis, build models, and create interactive data applications that combine computation and visualization. |
Data Source Connectivity | Hex primarily connects to modern cloud data warehouses such as Snowflake, BigQuery, Redshift, and PostgreSQL. Queries typically run directly against the warehouse, though the platform provides fewer direct SaaS connectors compared to traditional BI tools. |
Self-Service Accessibility | Hex is designed primarily for analysts and technical users working with SQL or Python. Business users usually interact with published dashboards or data apps rather than performing analysis directly. |
Governance and Data Trust | Access control is managed through workspace permissions and integrations with the underlying data warehouse, where most governance policies and security rules are enforced. |
Operational Cost | Hex uses a subscription pricing model based on users and workspace usage, with total cost also influenced by the compute usage of the connected data warehouse. |
How to Choose
The platforms in this list differ significantly on where governance lives and how they handle questions outside pre-built models. The real differences appear when you apply the five architectural criteria to how each platform actually handles questions at scale, enforces governance, and manages concurrent workloads.
Platform | Analytical Depth | Data Source Connectivity | Self-Service Accessibility | Governance and Data Trust | Operational Cost |
|---|---|---|---|---|---|
Genloop | ✓ | ✓ | ✓ | ✓ | ✓ |
Power BI | ◐ | ✓ | ◐ | ✓ | ◐ |
Tableau | ◐ | ✓ | ◐ | ✓ | ◐ |
Qlik Sense | ◐ | ◐ | ◐ | ◐ | ◐ |
Hex | ✓ | ◐ | ✕ | ◐ | ◐ |
FAQs
What are the best alternatives to Looker for modern analytics?
Several analytics platforms are commonly considered as alternatives to Looker, including tools like Power BI, Tableau, Qlik Sense, and Mode Analytics. These platforms focus on dashboards and data exploration. Platforms like Genloop take a different approach by enabling agentic analytics, where business users can ask questions in natural language and receive governed answers directly from enterprise data.
How does Genloop compare to Looker?
Looker focuses on a semantic layer where analysts define metrics and models before users explore data. Genloop focuses on agentic analytics, allowing users to ask questions in natural language while still respecting governance rules and access controls. This approach can reduce the need for pre-built dashboards when teams want to investigate new questions.
Can business users analyze data without SQL in tools like Looker?
In many BI platforms, business users explore data through dashboards that analysts create in advance. When new questions arise, analysts may need to update models or build new reports. Genloop allows business users to ask questions in natural language, helping teams explore data without writing SQL while still using governed enterprise datasets.
Do I need to move my data to use analytics platforms like Looker alternatives?
Most modern analytics platforms connect directly to existing data sources such as cloud data warehouses and databases. Tools like Genloop query data from connected sources rather than requiring organizations to move or duplicate their data into a separate system.
What should companies consider when choosing a Looker alternative?
Organizations often evaluate several factors when choosing a Looker alternative, including analytical capabilities, data connectivity, self-service access, governance features, and overall cost. Platforms like Genloop focus on agentic analytics and governed question-answering, which can help business teams explore data more easily while maintaining data control.