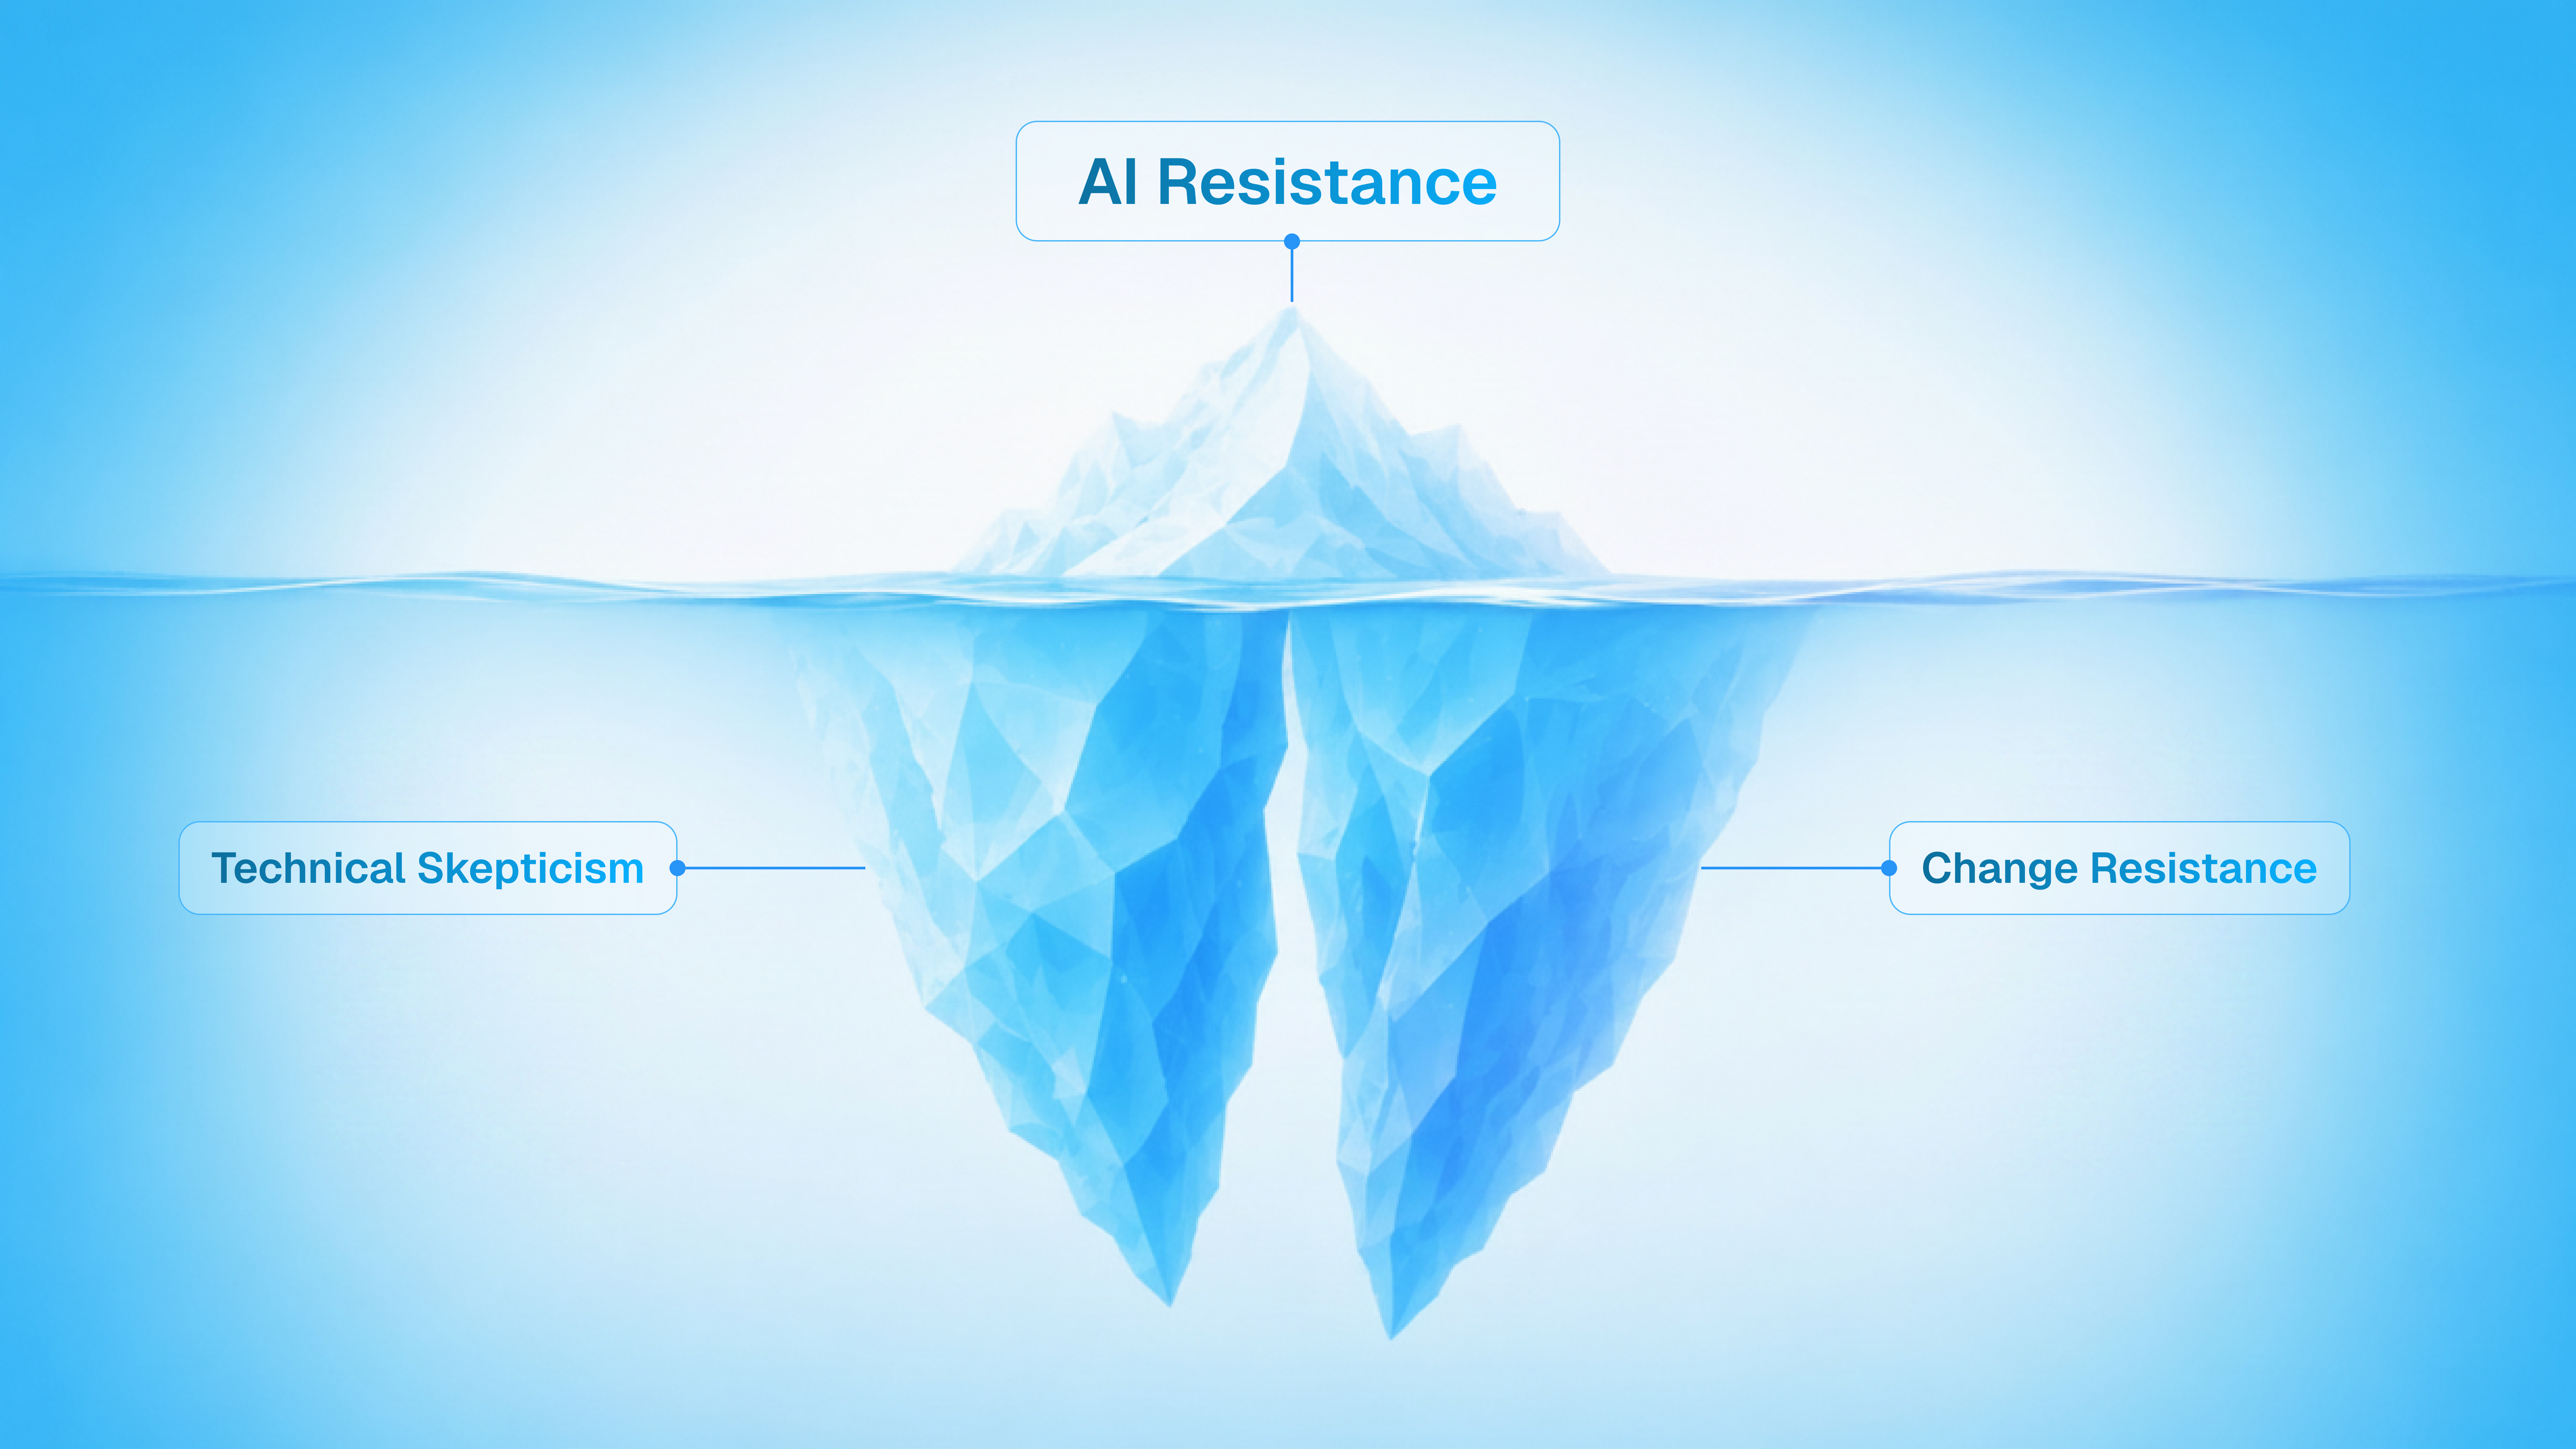
Most BI deployments follow the same pattern. A data team ingests company data into a platform, defines business logic in a semantic layer, and builds dashboards on top. Business users get a set of pre-built views. Any question outside those views gets filed as a request and answered days later, if at all.
The problem surfaces the moment someone asks a question the dashboard was not built for. A sales leader asks "What is our customer acquisition cost?" and gets two different numbers before lunch. Marketing calculates CAC using total campaign spend divided by new leads. Finance uses a fully loaded model that includes overhead and sales compensation. The platform returns both without flagging the conflict.
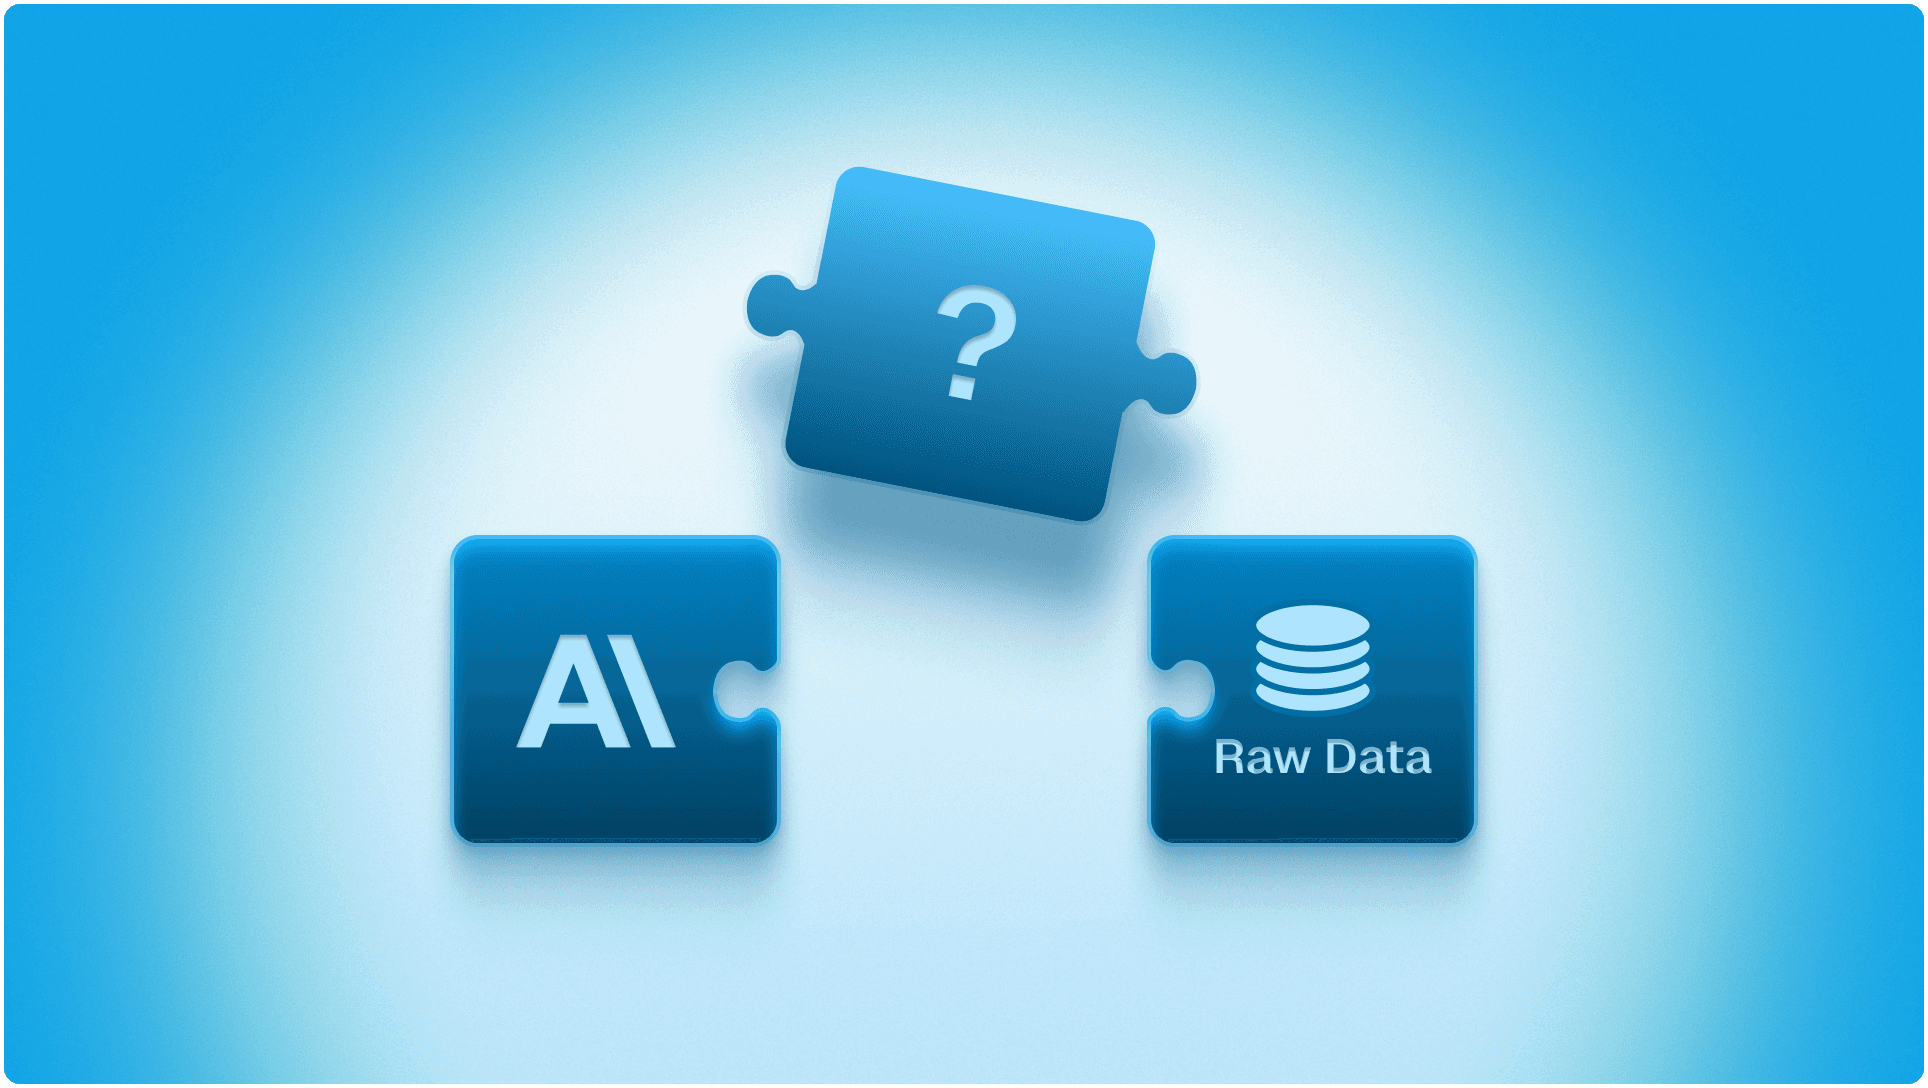
The barrier is not the interface. It is semantic accuracy. When platforms cannot map business terminology to the correct calculation logic for each team's context, natural language querying produces answers that are plausible but wrong. This evaluation examines five platforms against the criteria that determine whether non-technical users will actually trust and adopt a BI tool in production.
Why BI Tools Fail for Business Users
The failure is structural. Four patterns repeat across organizations regardless of which traditional BI platform they use.
Every new question creates a ticket. Any question outside a pre-built dashboard requires a data analyst. Business users file requests, analysts build queries, and the queue grows. Decisions get delayed or made without data.
Dashboards do not investigate. A dashboard answers the question someone already had when they built it. "Why is churn higher in this region?" requires a different query, different joins, and usually a different analyst. The tool does not scale to actual investigation.
The number exists. The reason does not. When a number looks wrong or interesting, business users have no path to understand why. They can see the metric, not the drivers behind it.
Information silos. Metric definitions differ across dashboards. Marketing and Finance often calculate the same metric differently. Without a centralized, validated semantic layer, the same question produces different answers depending on which dashboard a user opens first.
How we Evaluate
Platforms are evaluated against criteria that determine adoption by non-technical users:
Self-Service Querying: Whether users can ask business questions without learning SQL, data modeling, or technical syntax
Semantic Accuracy: Whether the platform understands company-specific metric definitions or generates plausible but incorrect answers
Root Cause Investigation: Whether the platform can answer "Why did this happen?" with multi-step analysis, not just "What is the number?"
Real-Time Collaboration: Whether teams can investigate together, share context, and pin insights without switching tools
AI Workflow Integration: Whether insights, alerts, and investigations integrate directly into collaboration tools like Slack, Teams, CRM systems, and operational workflows
Cost Model: Whether pricing scales with value delivered or locks organizations into per-seat licensing and data copy fees
Platforms covered: Genloop, Power BI, Tableau, ThoughtSpot, and Qlik Sense.
The Leading Platforms
1. Genloop
Best for: Organizations that need conversational analytics with semantic reasoning and autonomous investigation across multiple data sources
Genloop is built on Unified Business Memory, a semantic layer designed for reasoning. Business Memory maps company-specific terminology to validated schema definitions and learns from human feedback as teams use the platform.
When users ask questions, the system reasons about intent, checks hypotheses against data, and returns driver-level explanations. Genloop scored 96.7% on Spider 2.0, the most rigorous enterprise text-to-SQL benchmark. The platform's enterprise-grade governance ensures accurate, auditable analytics.
Criterion | Performance |
|---|---|
Self-Service Querying | Natural language interface requires no SQL or technical training |
Semantic Accuracy | Business Memory maps business terms to governed schema definitions with human validation |
Root Cause Investigation | Autonomous agents perform multi-step analysis and driver identification |
Real-Time Collaboration | Liveboards allow teams to pin insights and investigate together |
AI Workflow Integration | Integrates with collaboration tools like Slack, APIs, and agentic workflows for agentic investigation across systems |
Cost Model | Warehouse-native architecture eliminates data copy costs |
2. Power BI
Best for: Microsoft-first organizations with existing M365 deployments
Power BI dominates enterprise BI because it bundles with Microsoft 365 and integrates with Excel, Teams, and Fabric. Power BI Q&A is being deprecated in December 2026, with Copilot as the replacement.
Copilot generates insights but relies on pre-built semantic models and DAX logic created by analysts. Investigation remains dashboard-centric rather than conversational.
Criterion | Performance |
|---|---|
Self-Service Querying | Copilot enables basic queries within pre-configured semantic models |
Semantic Accuracy | Uses analyst-created Power BI semantic models and DAX definitions |
Root Cause Investigation | Optimized for single-query answers, not multi-step investigation |
Real-Time Collaboration | Microsoft Teams integration enables sharing within M365 |
AI Workflow Integration | Deep integration with Microsoft Teams, Excel, and Microsoft Copilot ecosystem |
Cost Model | Bundled with M365 licenses, Fabric costs scale with usage |
3. Tableau
Best for: Organizations with clearly defined KPIs that want automated anomaly detection
Tableau Pulse replaced Tableau Ask Data in 2024. Built around a centralized metrics layer, Pulse automatically surfaces insights and anomalies. The platform is designed for metric monitoring, not open-ended exploration.
Tableau Pulse requires analysts to configure the metrics layer before business users can interact. Available only in Tableau Cloud.
Criterion | Performance |
|---|---|
Self-Service Querying | Natural language focused on pre-defined metrics, not exploratory questions |
Semantic Accuracy | Metrics layer centralizes definitions but requires analyst configuration |
Root Cause Investigation | Monitors metrics and detects anomalies but not autonomous root cause analysis |
Real-Time Collaboration | Users share metrics and insights within Tableau Cloud |
AI Workflow Integration | Supports embedded analytics, integrations, and AI-driven search workflows through Spotter |
Cost Model | Cloud pricing tied to user licenses and data refresh frequency |
4. ThoughtSpot
Best for: Search-driven exploration with governed semantic models
ThoughtSpot allows users to search business data using natural language. The platform translates search queries into governed SQL through Spotter, its AI assistant. ThoughtSpot requires data teams to curate datasets and maintain semantic models.
Business users search within pre-modeled data without writing SQL.
Criterion | Performance |
|---|---|
Self-Service Querying. | Search interface enables queries within pre-modeled semantic layers |
Semantic Accuracy | Depends on analyst-curated semantic models and synonym configurations |
Root Cause Investigation | Supports follow-up searches but requires manual user refinement |
Real-Time Collaboration | Users share searches and pin findings to collaborative boards |
AI Workflow Integration | Supports embedded analytics, integrations, and AI-driven search workflows through Spotter |
Cost Model | Pricing scales with usage tiers and semantic modeling overhead |
5. Qlik Sense
Best for: Business users who prefer visual exploration through associative data discovery
Qlik Sense uses an associative engine that allows users to explore data by clicking through visualizations. The platform highlights relationships between data points and enables self-service exploration. Business users see how selections affect the entire dataset without writing queries.
Qlik Sense works best for users comfortable navigating data relationships visually. The platform provides strong exploration capabilities with less technical training than traditional BI tools.
Criterion | Performance |
|---|---|
Self-Service Querying. | Relies on visual exploration and clicking through associations rather than natural language |
Semantic Accuracy | Users must understand data relationships and structures to explore effectively |
Root Cause Investigation | Supports exploratory analysis through associations but requires manual navigation |
Real-Time Collaboration | Users share dashboards and analyses within Qlik environment |
AI Workflow Integration | Integrates dashboards and analytics into enterprise workflows through APIs and collaboration tools |
Cost Model | Pricing based on user licenses and deployment type |
How to Choose the Right Platform
The right choice depends on how non-technical users need to interact with data and whether the organization has resources to maintain semantic layers.
Tool | Most suitable when | Less suitable when |
|---|---|---|
Genloop | Non-technical users need autonomous investigation across systems without waiting on analysts | Data sits entirely within one warehouse and requirements stop at single-query lookups |
Power BI | Organization uses Microsoft ecosystem and users work primarily in Teams and Excel | Users need investigation beyond dashboard exploration |
Tableau | Organization has clearly defined metrics and wants automated anomaly detection | Users need exploratory root cause analysis across data sources |
ThoughtSpot | Users prefer search-based exploration and organization maintains semantic models | Data spans systems without centralized semantic preparation |
Qlik Sense | Users comfortable with visual exploration and understanding data relationships through associations | Non-technical users need guided natural language investigation without learning data structures |
FAQs
1. Why do different teams get different numbers for the same metric?
This happens when metrics are defined differently across dashboards and tools. Marketing calculates customer acquisition cost using campaign spend divided by leads. Finance includes overhead and sales compensation. Without a centralized semantic layer, each tool produces different results. Genloop's Business Memory maintains context-aware definitions so teams see which calculation was used rather than choosing between conflicting outputs.
2. What makes agentic analytics different from conversational BI?
Conversational BI (like ThoughtSpot) allows users to ask questions and receive visualizations based on pre-modeled data. Agentic analytics (like Genloop) performs autonomous multi-step investigation. When a user asks "Why did churn increase in Q3?" conversational tools return a chart. Agentic platforms break the question into investigative steps, segment by cohort, identify contributing factors, and return ranked drivers with evidence.
3. How does Genloop handle metric definitions when different teams calculate metrics differently?
Genloop's Business Memory maps business terminology to validated schema definitions through human-in-the-loop feedback. When Finance and Marketing define customer acquisition cost differently, Business Memory maintains both definitions with context about which applies in which scenario. Users see which definition was used for their query.
4. Do non-technical users need training to use these tools?
Most conversational and agentic BI platforms are designed so business users can query data in plain language without learning SQL or data modeling syntax. In practice, adoption depends on how well the platform understands company-specific terminology out of the box. Platforms that rely on analyst-configured semantic models require data teams to pre-define every business term before users can query reliably. Platforms with continuous learning mechanisms reduce this setup burden over time by building context from actual usage patterns.