Product teams today generate more event data than ever before. Yet simple questions such as why retention declined by three percentage points last week often remain difficult to answer. Instrumentation is typically in place and data warehouses are well maintained. Even so, producing reliable insight still requires manual analysis and significant data team involvement.
The limitation is structural. Most product analytics platforms were designed to measure user behavior within event streams. They were not built to reason across multiple enterprise data sources, interpret company-specific business terminology, or connect product events with signals from finance, operations, and customer support without extensive data pipelines.
TLDR
This blog evaluates product analytics platforms based on the capabilities that determine whether product teams can reliably understand user behavior and product impact at scale.
Release Impact Analysis — The ability to measure the impact of product releases by comparing behavioral and engagement metrics across versions to determine whether new features improved or degraded user experience.
Behavioral Cohort Intelligence — The platform’s ability to identify high-value user cohorts and power users based on behavioral engagement patterns rather than static segmentation.
Product Metric Consistency — Whether the platform enforces consistent definitions for product metrics such as activation, retention, churn, and active users across teams and analyses.
Cross-Source Product Intelligence — The ability to correlate product usage data with signals from other systems such as CRM, finance, and support to explain why product metrics change.
Platform Cost Scalability — Whether the cost of the platform remains manageable as product usage, data volume, and analytics adoption grow.
The five platforms covered: Genloop, Amplitude, ThoughtSpot Spotter, Databricks Genie and Hex.
Why Most Analytics Platforms Fail in Production
Most product analytics platforms struggle in enterprise environments for structural reasons. The limitations are not about missing features but about how these systems were originally designed.
Fragmented metric definitions: Product metrics often lack consistent definitions across teams. Terms such as activation, retention, and active users are implemented differently across dashboards and analyses. Without a governed semantic layer enforcing shared definitions, organizations end up making decisions based on conflicting numbers.
Limited reasoning across data sources: Even when platforms support natural language queries, most systems still operate on narrow schema contexts. Questions that require joining multiple datasets, applying business logic, and calculating derived metrics often produce unreliable results. This limits the ability of product teams to investigate the underlying causes of metric changes without data team involvement.
Top Platforms:
1. Genloop
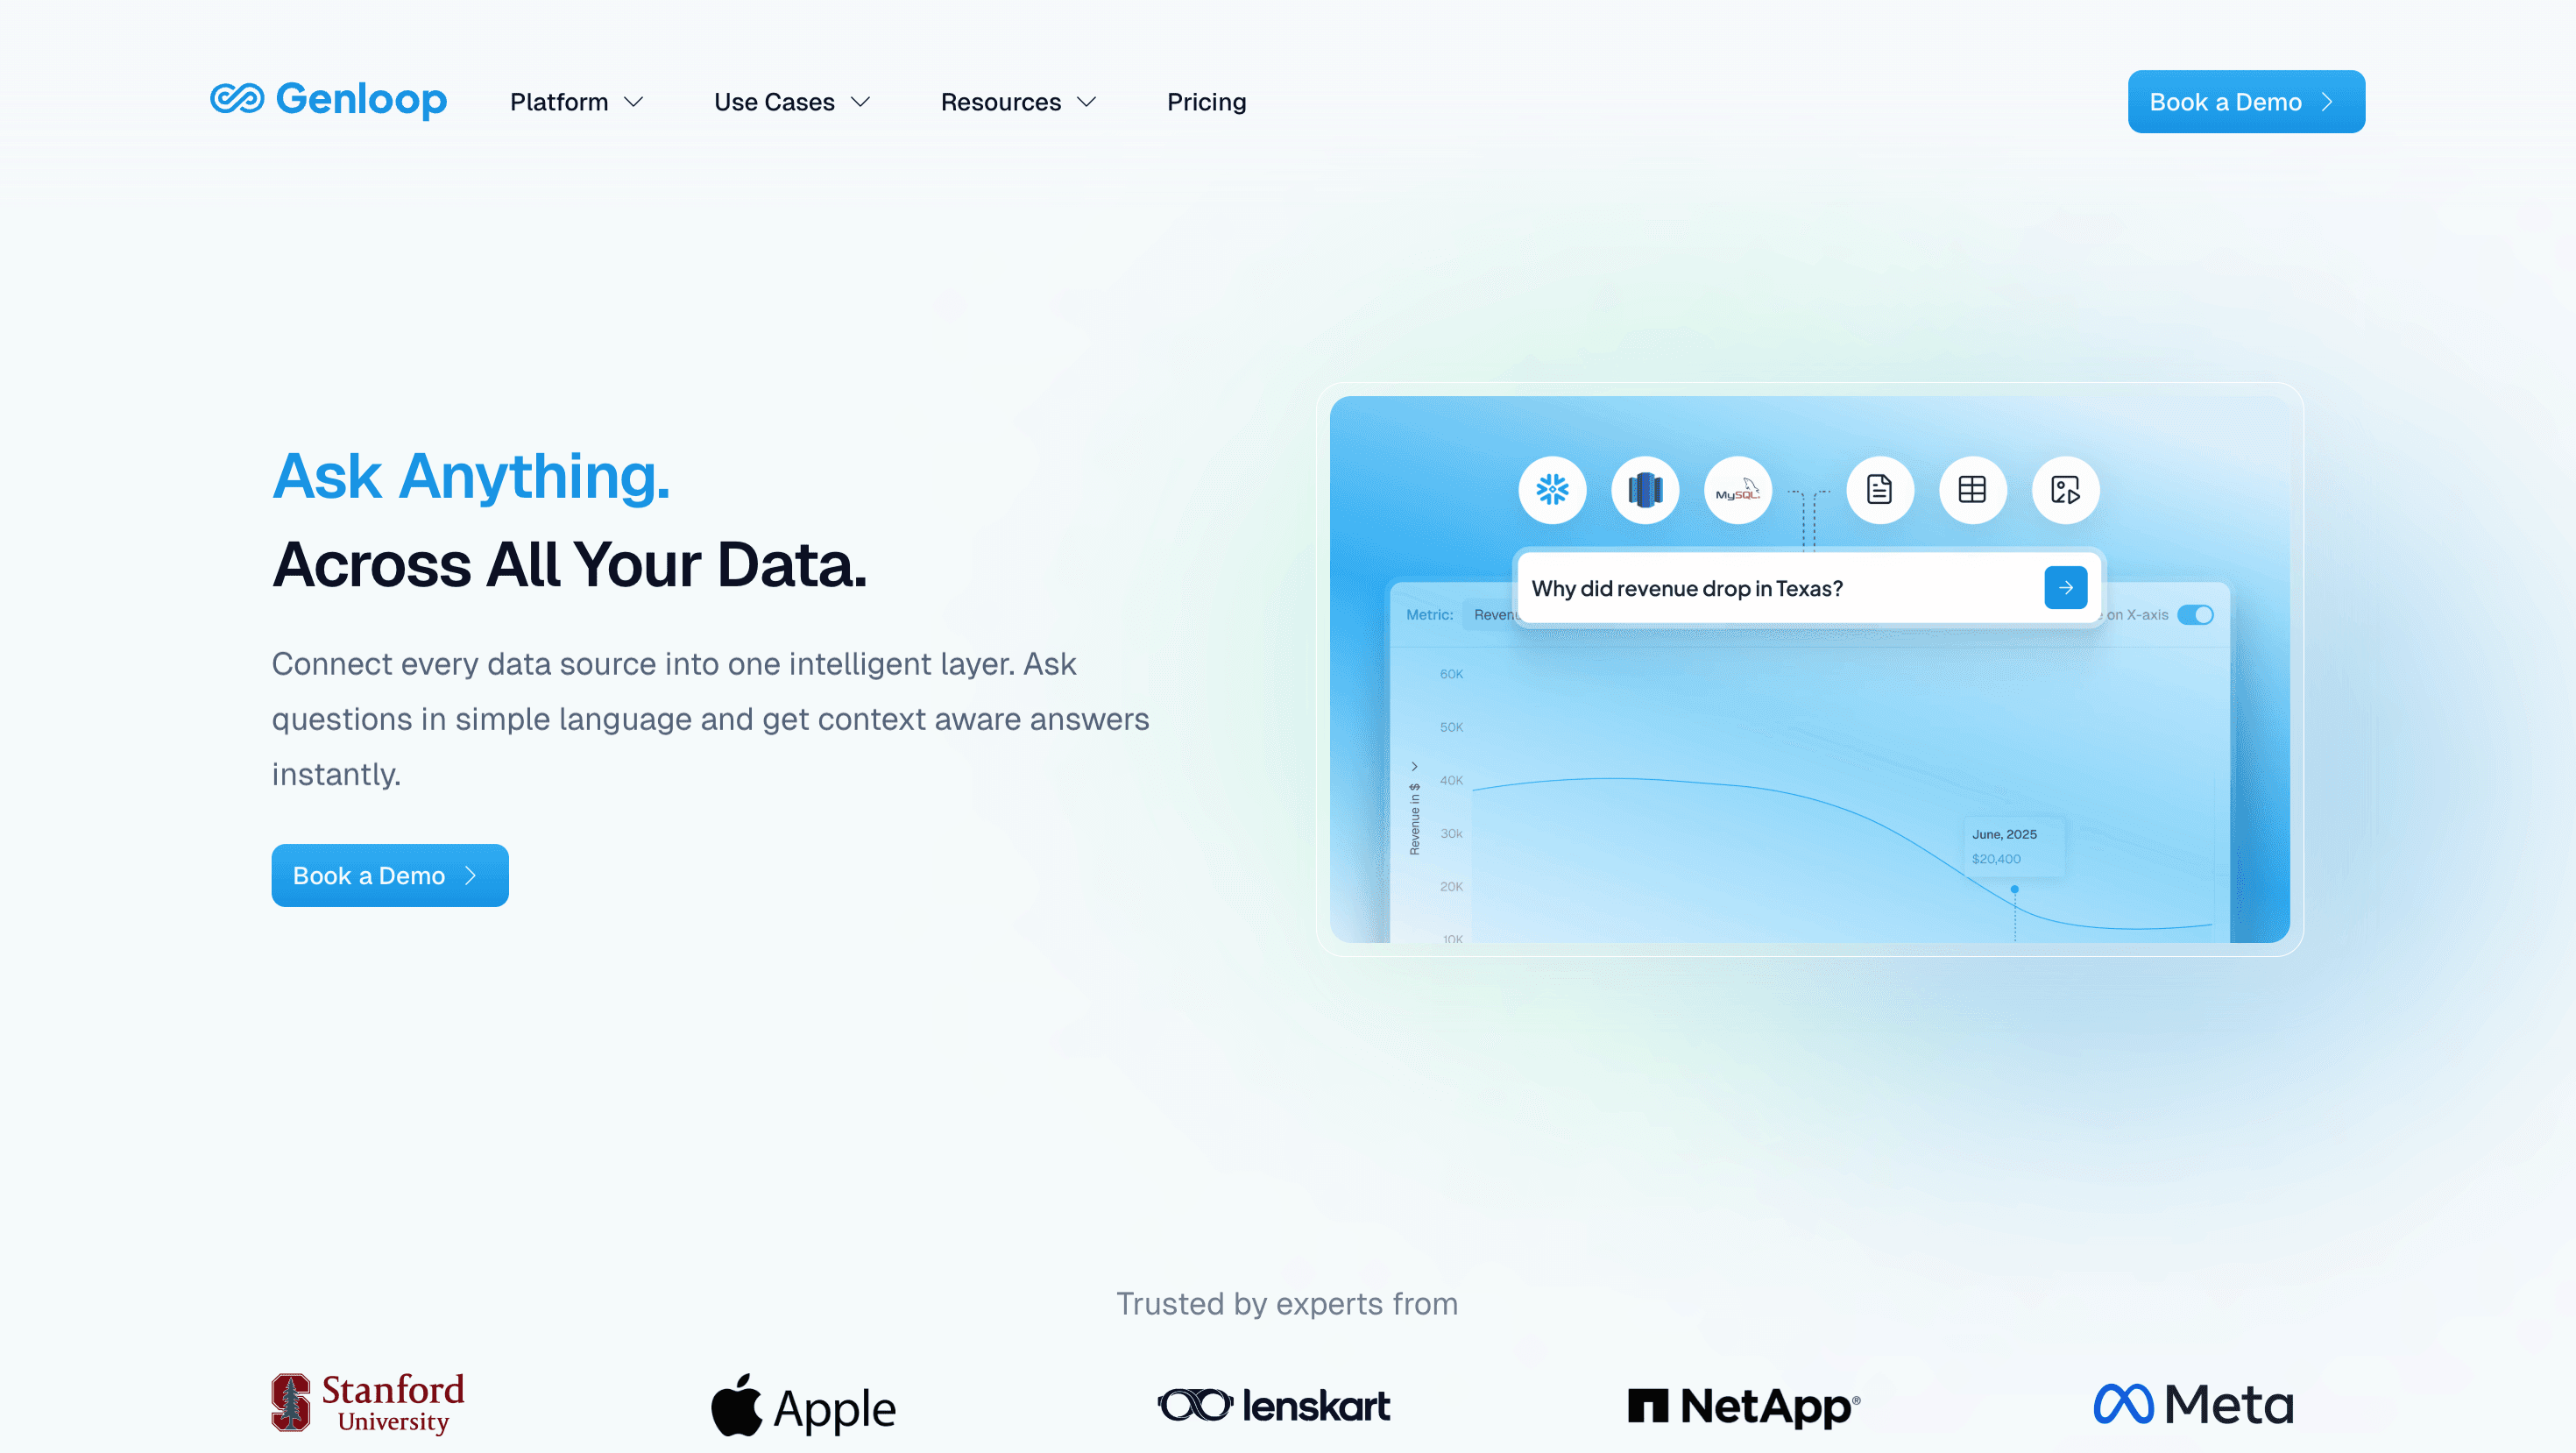
Best for: Enterprise product teams that need cross-functional reasoning, governance, and reliable execution across all data sources
Genloop is built for product analytics at enterprise scale, but it doesn't stop at event data. It connects to your warehouse, CRM, finance system, and support data in a single semantic layer. The Business Memory layer maps company-specific terminology ("KYC renewal rates," "high-risk accounts," "store-level ATV") to the right calculations across all sources. A product manager can ask "Show me 30-day retention by cohort, correlated with support ticket volume" and get an answer in seconds, with full reasoning explainability.
Genloop also emphasizes reliability and enterprise governance. It has achieved 96.7% accuracy on the Spider 2 benchmark, a widely used evaluation for complex multi-table SQL generation, and includes a reliability engine that flags uncertain answers instead of returning silent errors. For enterprise deployments, the platform supports SOC 2 Type II compliance, ISO 27001 certification, and row- and column-level security, ensuring product analytics workflows operate within governed access controls.
Dimension | How Genloop performs |
|---|---|
Release Impact Analysis | Enables teams to evaluate product changes by analyzing product metrics together with operational signals from connected enterprise data sources. |
Behavioral Cohort Intelligence | Cohort and retention analysis can be generated through natural language queries executed on warehouse data. |
Product Metric Consistency | Business Memory and the semantic layer map business terminology to consistent metric definitions across queries. |
Cross-Source Product Intelligence | Designed to query product, CRM, finance, and operational data through a unified semantic layer. |
Platform Cost Scalability | Optimized token economics via smaller models focused on analytics workflows (designed to keep per-question cost predictable at scale). |
2. Amplitude
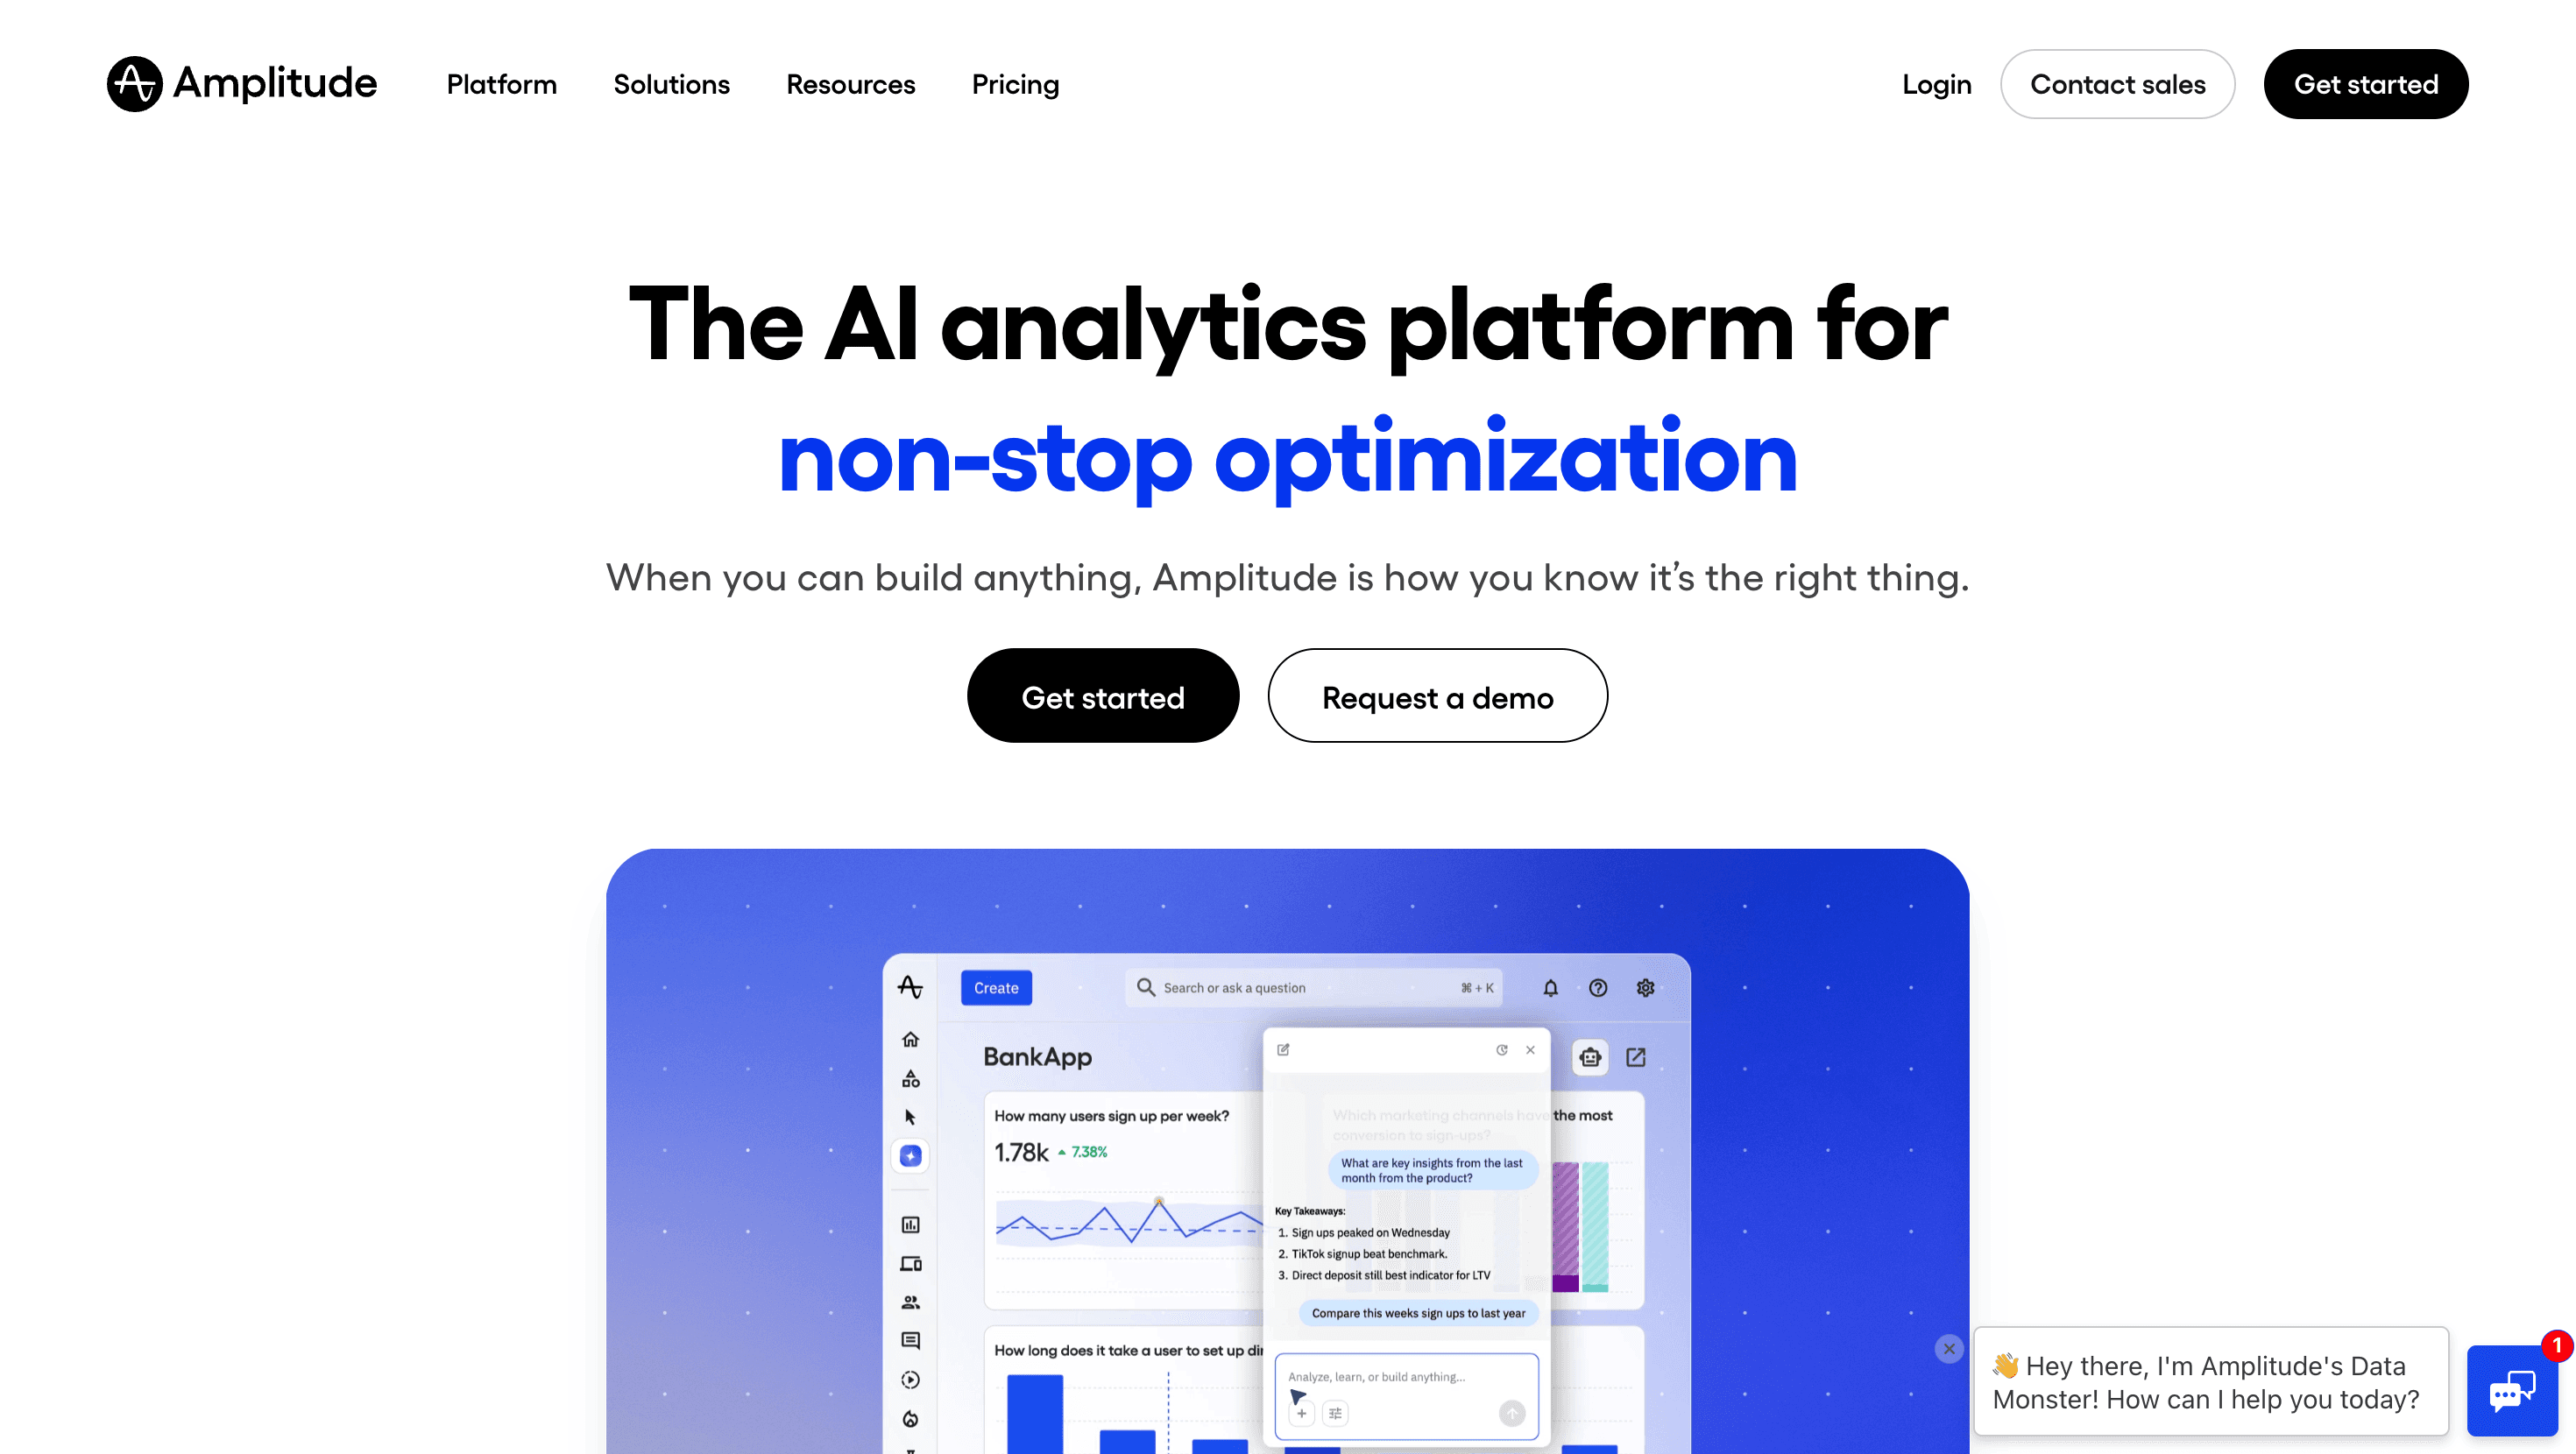
Best for: Product-focused teams where user behavior is the primary signal and cross-functional reasoning is not a priority
Amplitude is the incumbent product analytics platform. Its Global Agent monitors metrics autonomously, detects anomalies, and recommends actions. For teams whose core question is "How are users engaging with our product?", it is the fastest path to an answer. The limitation is structural: Amplitude only sees event data.
Dimension | How Amplitude performs |
|---|---|
Release Impact Analysis | Provides built-in tools to analyze feature adoption, engagement, and retention changes after product releases. |
Behavioral Cohort Intelligence | Includes native product analytics workflows such as cohorts, funnels, and retention analysis based on event data. |
Product Metric Consistency | Metric definitions can be managed within Amplitude projects but may vary across teams depending on configuration. |
Cross-Source Product Intelligence | Primarily analyzes event data collected within the Amplitude platform. |
Platform Cost Scalability | Pricing is typically based on event volume and platform usage. |
3. ThoughtSpot
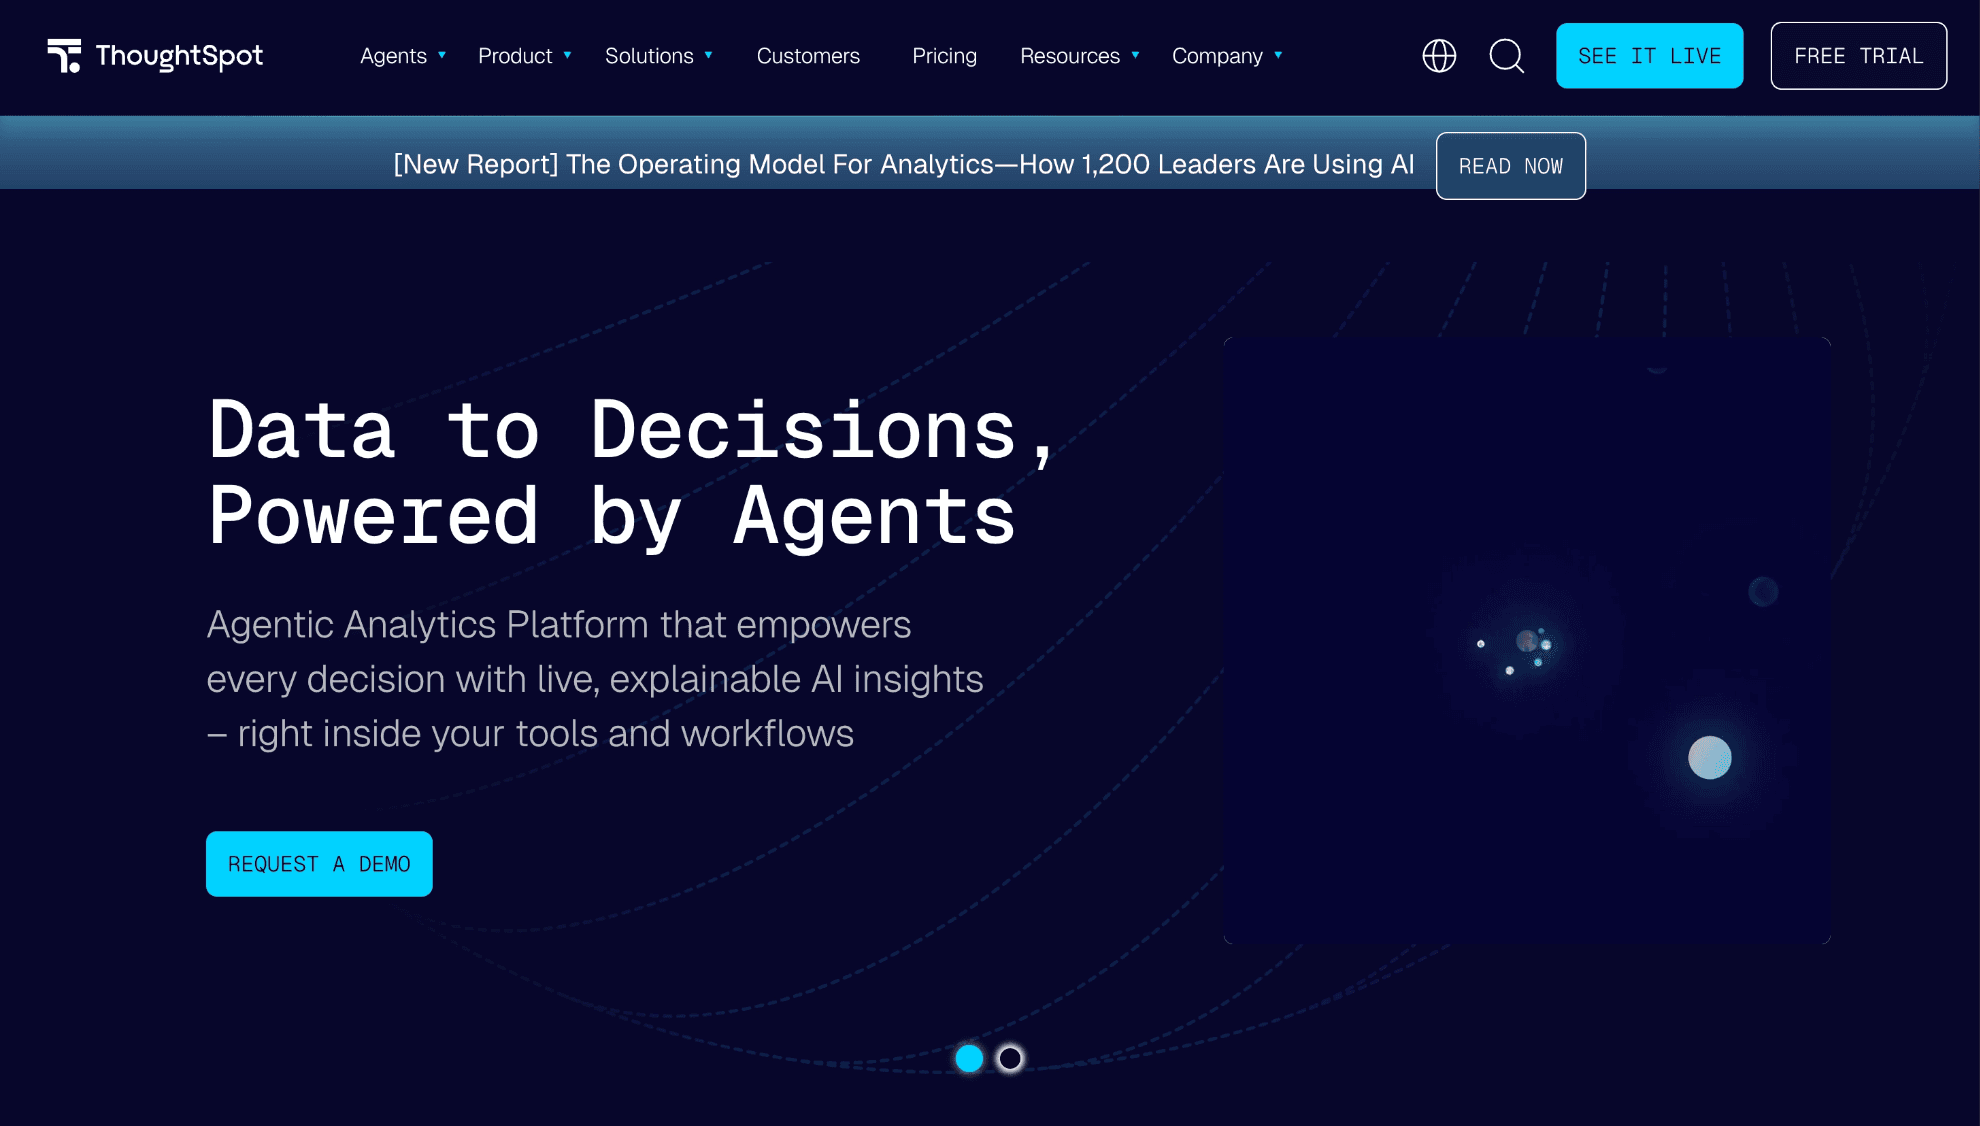
Best for: Search-driven enterprise BI with governed semantic context, not purpose-built for product analytics workflows
ThoughtSpot's Spotter resolves natural language questions to governed metrics rather than raw schema guesses. For enterprises that have already invested in modeling their warehouse, it delivers consistent results on defined domains.
Dimension | How ThoughtSpot performs |
|---|---|
Release Impact Analysis | Product release analysis is possible when relevant datasets and metrics are modeled in the ThoughtSpot semantic layer. |
Behavioral Cohort Intelligence | Cohort analysis can be performed through queries on modeled data but is not provided as a dedicated product analytics workflow. |
Product Metric Consistency | The ThoughtSpot semantic model allows organizations to define governed metrics used across queries and dashboards. |
Cross-Source Product Intelligence | Multiple datasets can be analyzed together when they are modeled in the semantic layer. |
Platform Cost Scalability | Pricing typically depends on enterprise licensing and usage tiers. |
4. Databricks Genie
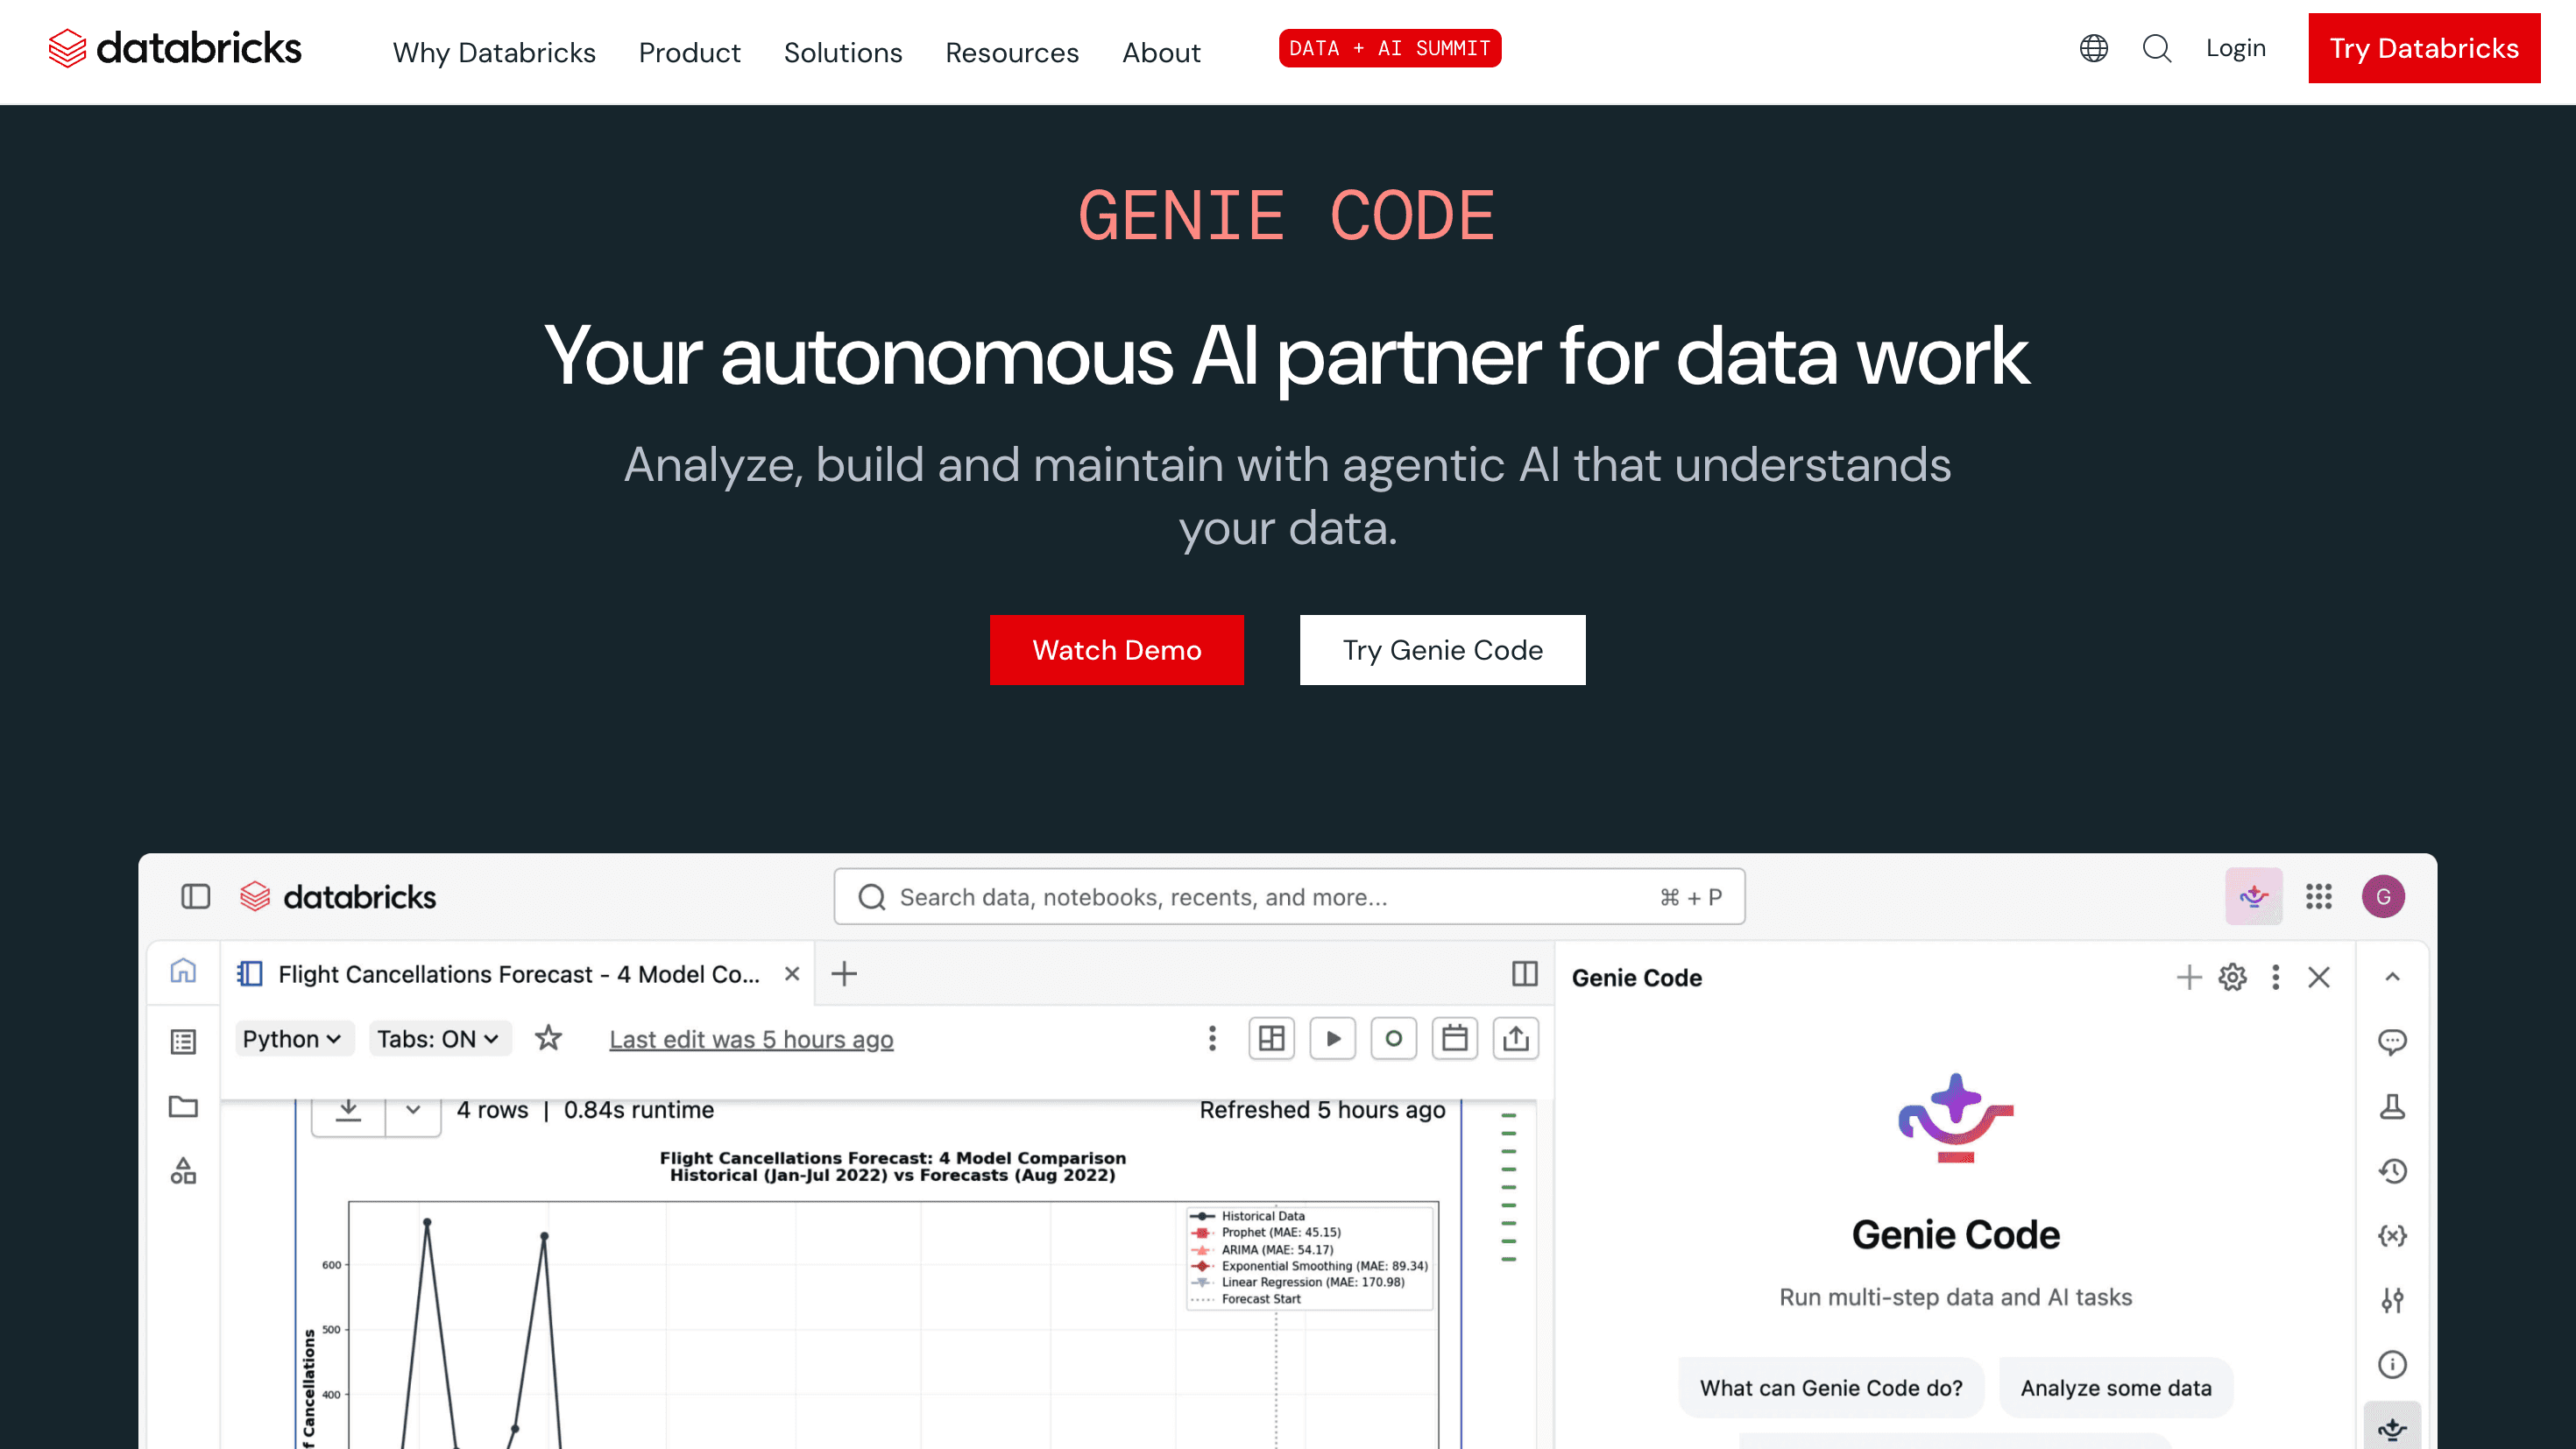
Best for: Data engineering teams already on the Databricks lakehouse stack who need basic business Q&A on governed data
Databricks approaches product analytics from an engineering angle. Genie handles natural language Q&A on governed Databricks data. Genie Code handles engineering-adjacent tasks. The architecture is strong if team lives in the lakehouse.
Dimension | How Databricks Genie performs |
|---|---|
Release Impact Analysis | Product metrics can be analyzed through SQL queries on lakehouse data managed within Databricks. |
Behavioral Cohort Intelligence | Cohort analysis can be implemented through SQL workflows on warehouse or lakehouse datasets. |
Product Metric Consistency | Governance and data definitions can be managed through Unity Catalog and data modeling practices. |
Cross-Source Product Intelligence | Genie can query datasets stored in the Databricks lakehouse environment. |
Platform Cost Scalability | Costs generally scale with compute usage and query workloads in the Databricks environment. |
5. Hex
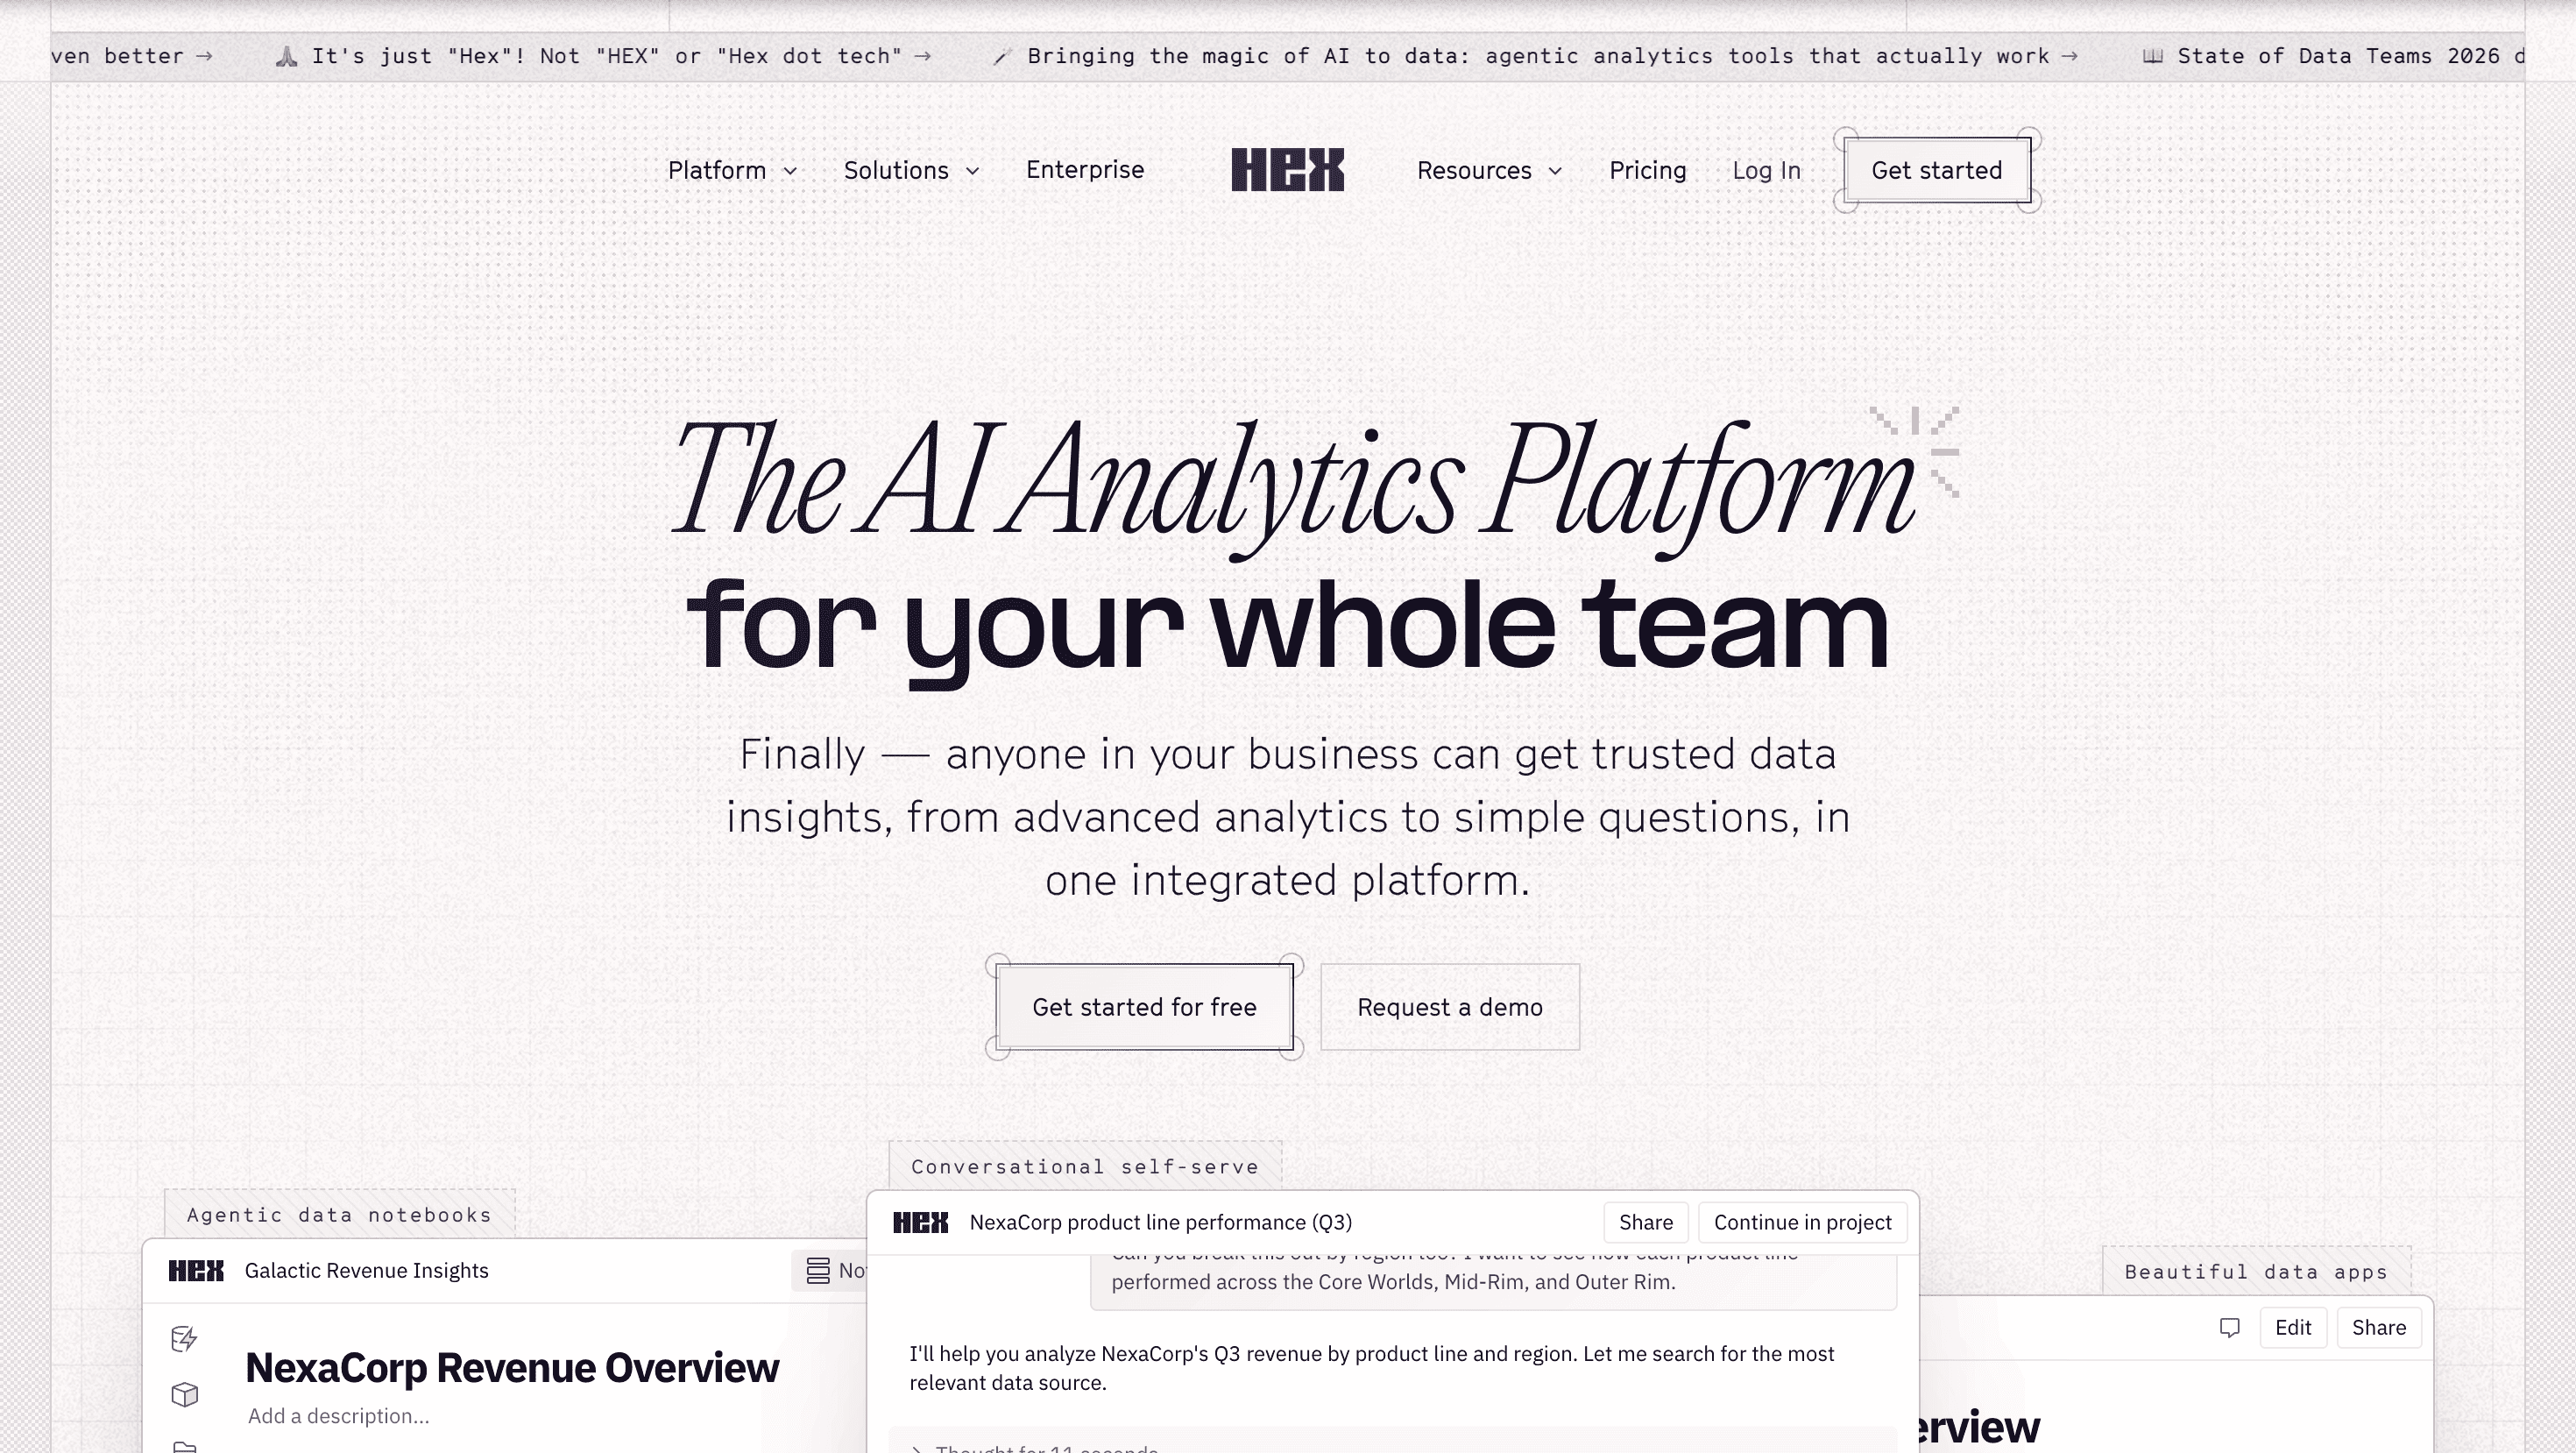
Best for: Data teams that want collaborative notebooks with AI-assisted analysis, not business-user self-serve
Hex is a collaborative data workspace where analysts build notebooks, SQL queries, and visualizations. Its AI features help analysts write and debug code faster. It's not a self-serve product analytics tool for business users. It's an analyst productivity platform with some agentic capability on top.
Dimension | How Hex performs |
|---|---|
Release Impact Analysis | Analysts can evaluate product changes through notebook-based analysis using SQL or Python queries. |
Behavioral Cohort Intelligence | Cohort analysis can be built manually within notebooks using SQL queries. |
Product Metric Consistency | Metric definitions depend on how queries and shared notebooks are structured by analysts. |
Cross-Source Product Intelligence | Multiple datasets can be analyzed together when combined through SQL or Python within notebooks. |
Platform Cost Scalability | Pricing is typically based on workspace usage and seat licensing. |
How to Choose
Platform | Release Impact Analysis | Behavioral Cohort Intelligence | Product Metric Consistency | Cross-Source Product Intelligence | Platform Cost Scalability |
|---|---|---|---|---|---|
Genloop | ✓ | ✓ | ✓ | ✓ | ✓ |
Amplitude | ✓ | ✓ | ◐ | ✗ | ◐ |
ThoughtSpot Spotter | ◐ | ◐ | ✓ | ◐ | ◐ |
Databricks Genie | ◐ | ◐ | ✓ | ◐ | ◐ |
Hex | ◐ | ◐ | ◐ | ◐ | ◐ |
FAQs
How is AI changing product analytics?
AI is making product analytics more conversational and automated. Instead of building dashboards or writing SQL, teams can ask questions in natural language and receive analysis instantly. Platforms like Genloop apply AI to reason across product, operational, and customer data to explain why product metrics change.
What is AI-powered product analytics?
AI-powered product analytics uses machine learning and natural language interfaces to analyze product data automatically. Rather than manually building queries or reports, users can ask questions and the system generates the analysis. Solutions such as Genloop combine AI with enterprise data access to analyze product metrics alongside CRM, finance, and support data.
Can AI analyze product data without SQL?
Yes. Modern analytics systems use NL2SQL technology to convert natural language questions into database queries. This allows product managers to explore retention, engagement, or feature adoption without writing SQL. Platforms like Genloop apply this approach to analyze product data directly in the warehouse.
How does AI help explain product metric changes?
Traditional tools show what happened—such as a drop in retention or engagement. AI analytics systems can investigate the underlying causes by correlating product data with other signals like support activity, pricing changes, or operational events. This helps teams understand why metrics change, not just that they changed.
What should teams look for in an AI product analytics platform?
Key capabilities include accurate natural language querying, access to multiple data sources, governed metric definitions, and enterprise security. Platforms like Genloop combine these capabilities with a semantic layer that helps teams analyze product metrics within the broader business context.