AI business intelligence tools are transforming how finance teams analyze enterprise data. Most financial analytics tools are built for reporting. Variance gets flagged. The chart updates. The question of why it happened does not get answered in the same place.
Finance teams typically work across four to six disconnected systems: ERP for actuals, CRM for revenue, HR for headcount, and separate cost center tracking that rarely maps cleanly to any of them. Cross-system analysis that should take minutes takes days when it has to move through an analyst queue.
By then, the forecast window has moved. Decisions get made on whatever explanation was available, not the complete one.
TLDR
This blog evaluates six platforms on five dimensions that determine whether AI-powered BI holds up in financial analytics production environments:
Financial Data Integration — The platform’s ability to analyze financial data across ERP, CRM, and warehouse systems without requiring manual exports or spreadsheet consolidation.
Analytical Reasoning — The ability to perform multi-step financial investigation and root cause analysis rather than relying only on dashboards or pre-built reports.
Governance and Auditability — Enforcement of row and column level security, role based access control, and traceable query execution at the data access and execution layer.
Query Accuracy — The consistency and reliability of answers generated on financial data without requiring manual validation before the output can be trusted.
Enterprise Scalability — The ability to support large datasets, many concurrent users, and diverse enterprise deployment environments without performance degradation.
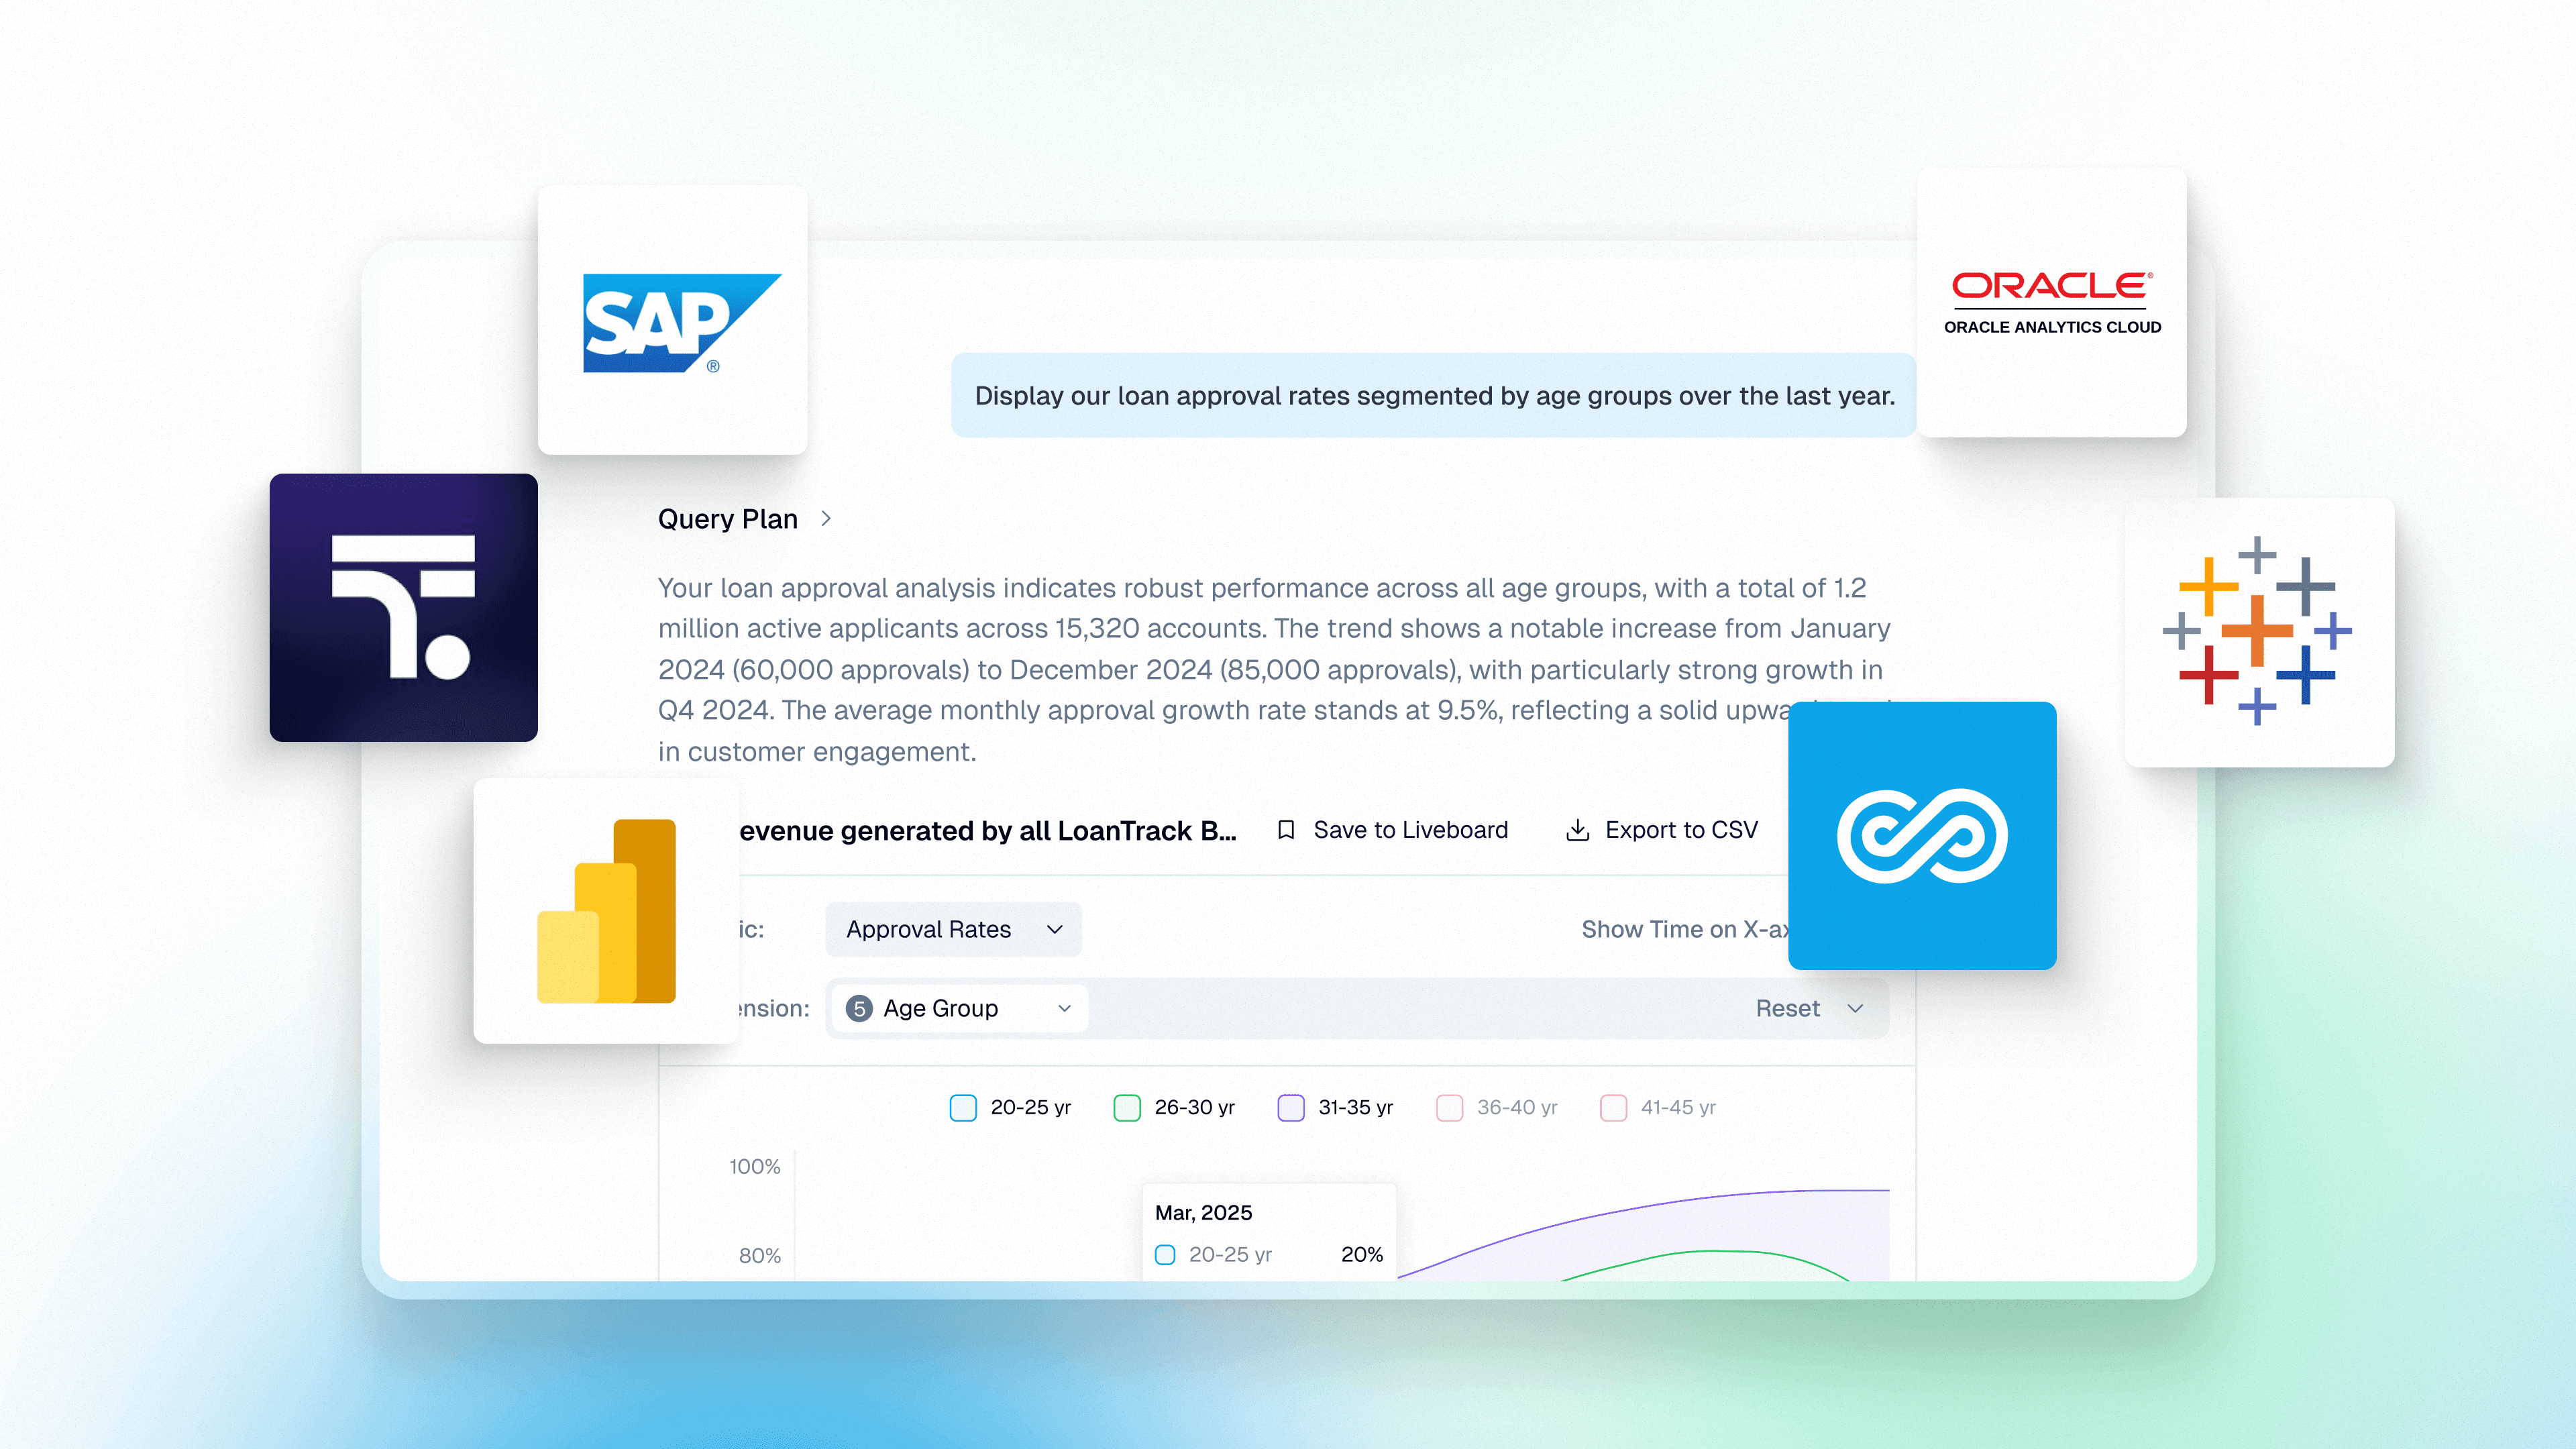
The platforms covered: Genloop, ThoughtSpot Spotter, Microsoft Power BI, Tableau Next, SAP BusinessObjects, and Oracle Analytics Cloud.
Why Financial Analytics Breaks in Production
Finance data is messy and fragmented. GL entries, sub-ledger transactions, treasury feeds, and ERP data all live in separate systems, built at different granularities, updated on different cycles. A question that crosses two of them usually lands on an analyst's plate.
That is the gap most BI tools never close.
Queries fail at the join. Finance questions are rarely single-source. "Why did gross margin drop?" requires joining revenue, COGS, FX adjustments, and cost center data. Without a semantic layer that understands those relationships, the platform guesses or hands the question back to a human.
Forecasts drift from actuals. Planning models live in FP&A tools. Actuals live in the warehouse. When those layers are disconnected, every reforecast cycle starts with a reconciliation exercise instead of an analysis.
Governance breaks when data moves. The moment a dataset is exported to Excel for analysis, the audit trail ends. Access controls and version history stop applying the second data leaves the governed environment.
What to Look for in AI Business Intelligence Tools for Financial Analytics
Query sources directly, without copying data. Financial data should be analyzed where it already lives. Moving it into extracts or spreadsheets breaks audit trails and introduces version drift. Direct querying keeps governance, lineage, and permissions intact.
Map business terms to lineage, not schema. Finance teams ask for metrics like net interest margin or gross margin, not table joins. Platforms need a semantic layer that resolves business terms to the correct join paths and metric definitions automatically.
Explain what changed and why. Identifying a spike in cost or margin is only the first step. Platforms must support multi-step root cause analysis that traces financial changes back to the underlying drivers.
Enforce access at the query layer. Security controls applied after a query runs can still leak sensitive data through intermediate results. Row and column level permissions must be embedded in query execution so every result respects the organization's governance policies.
The platforms that get this right answer financial questions inside the same governance perimeter that the audit team relies on, without requiring an analyst to step in and bridge the gap.
The Six Platforms
1. Genloop
Best for: Enterprise finance teams that need governed, multi-step analytical reasoning across complex data sources
Genloop is the most accurate data reasoning platform available, scoring 96.7% on Spider 2. It is the only platform that builds a multi-modal context graph of the enterprise and continuously refines it with usage. For finance, domain terms like "unrealized FX gain" or "net interest margin" are stored in Unified Business Memory, mapped to data lineage at the source level, and available to every query without manual rebuilding.
Dimension | How Genloop performs |
|---|---|
Financial Data Integration (✓) | Connects directly to Snowflake, Databricks, BigQuery, Redshift, PostgreSQL, and SQL Server. Queries financial data across ERP, CRM, and data warehouse systems without requiring exports or manual consolidation. |
Analytical Reasoning (✓) | Supports multi-step financial investigation including root cause analysis and decision automation through specialized agents. Built for questions that cross systems, not just questions someone anticipated and pre-modeled. |
Governance and Auditability (✓) | Row and column access controls are built into the execution layer, not applied after the fact. Every query step is traceable. Supports cloud, on-premises, and air-gapped deployment for finance teams with strict data residency requirements. |
Query Accuracy (✓) | Distilled models with proprietary retrieval. A reliability engine blocks low-confidence joins, flags uncertain answers, and supports human-in-the-loop validation workflows before results are used in reports or decisions. |
Enterprise Scalability (✓) | Builds a comprehensive context graph of the enterprise with minimal ongoing maintenance. Designed for broad coverage including long-tail queries, so finance teams are not limited to questions someone anticipated and pre-modeled. |
2. ThoughtSpot Spotter
Best for: Enterprise finance teams that need governed, search-driven analytics on a well-maintained semantic model
Spotter is ThoughtSpot's AI agent that sits on top of their semantic layer, translating plain English questions into governed metrics rather than guessing directly from raw database schema.
Dimension | How ThoughtSpot Spotter performs |
|---|---|
Financial Data Integration (◐) | Connects to major cloud data warehouses, but cross-system financial analysis still depends on how thoroughly the underlying semantic model has been built and maintained. |
Analytical Reasoning (◐) | Strong for search-driven exploration within the modeled semantic layer. Multi-step investigation on questions outside that layer degrades and typically requires analyst involvement. |
Governance and Auditability (✓) | Enterprise governance posture with controlled metric definitions and semantic mappings. Deterministic query execution produces consistent, auditable results within the scope of the model. |
Query Accuracy (✓) | Search token architecture produces repeatable outputs within the coverage of the semantic model. Accuracy depends on how well that model has been defined and kept current. |
Enterprise Scalability (◐) | Can scale to many users, but practical scale is gated by the ongoing cost of semantic modeling and the complexity of managing metric governance as the business changes. |
3. Microsoft Power BI
Best for: Large enterprises already standardized on Microsoft 365 and Azure
Microsoft Power BI is a widely adopted business intelligence and data visualization platform used to analyze data and build interactive dashboards. It is part of the Microsoft Power Platform ecosystem and integrates with a wide range of cloud and on-premises data sources.
Dimension | How Microsoft Power BI performs |
|---|---|
Financial Data Integration (◐) | Connects to a broad range of data sources, but cross-system financial analysis typically requires pre-built dataflows or manual data preparation before queries can run across systems. |
Analytical Reasoning (◐) | Good for standard reporting and dashboards. Deep-dive financial investigation requires complex DAX modeling and is generally analyst-dependent rather than self-serve for finance users. |
Governance and Auditability (◐) | Integrates with Microsoft Purview, but managing governance and access controls across disjointed workspaces can become fragmented as deployments scale. |
Query Accuracy (◐) | Core reporting is deterministic, but AI features like Copilot rely on how well the semantic model has been built, which introduces variability on questions outside the modeled scope. |
Enterprise Scalability (✓) | Most widely deployed BI platform globally. Integrates deeply with Excel, Teams, and SharePoint, making adoption low-friction in Microsoft-standardized organizations. |
4. Tableau Next
Best for: Salesforce-ecosystem enterprises that need agentic analytics embedded into existing workflows
Tableau, part of Salesforce, is a widely used analytics and data visualization platform known for interactive dashboards and visual data exploration. Salesforce has been expanding it with AI capabilities including natural language querying and generative AI assistants.
Dimension | How Tableau Next performs |
|---|---|
Financial Data Integration (◐) | Connects to a variety of databases and cloud data warehouses, but complex financial logic that spans multiple systems often requires additional data modeling outside the platform before it can be queried. |
Analytical Reasoning (◐) | Strong for visual analytics and exploratory analysis. Deeper financial investigations typically require analyst-built workflows rather than self-serve multi-step reasoning. |
Governance and Auditability (◐) | Supports governed data models and role-based access control, with governance strongest within the Salesforce ecosystem and requiring additional configuration for external environments. |
Query Accuracy (◐) | Mature visualization platform with consistent reporting when models are defined. Analytical depth beyond those models depends on analyst involvement. |
Enterprise Scalability (✓) | Built for enterprise deployments and capable of handling large datasets when connected to modern data warehouses. |
5. SAP BusinessObjects
Best for: Large enterprises running SAP ERP that need stable, high-volume financial reporting at scale
SAP BusinessObjects is an enterprise business intelligence and reporting platform widely used in large organizations for structured reporting and analytics. It is commonly deployed in environments running SAP S/4HANA, SAP BW, or SAP HANA.
Dimension | How SAP BusinessObjects performs |
|---|---|
Financial Data Integration (◐) | Integrates tightly with SAP data environments. Analysis that spans non-SAP systems requires additional configuration and data preparation work. |
Analytical Reasoning (◐) | Strong for structured financial reporting and standardized enterprise reports. Advanced exploratory analytics beyond pre-defined reports typically requires additional tooling. |
Governance and Auditability (✓) | Long-established governance capabilities including role-based access control, auditability, and strong integration within SAP data environments. |
Query Accuracy (✓) | Stable deployments in many large enterprises with consistent reporting through governed semantic models and a long track record in production financial environments. |
Enterprise Scalability (◐) | Scales well for high-volume enterprise reporting, though flexibility for modern analytics workloads outside structured reporting can be more limited. |
6. Oracle Analytics Cloud
Best for: Large enterprises running Oracle Fusion ERP or Oracle Cloud Applications that need tightly integrated financial analytics
Oracle Analytics Cloud is Oracle's cloud-based analytics and business intelligence platform, built to provide data visualization, reporting, and advanced analytics. It is commonly used by organizations running Oracle Fusion Cloud Financials and Oracle Enterprise Performance Management.
Dimension | How Oracle Analytics Cloud performs |
|---|---|
Financial Data Integration (◐) | Integrates well within Oracle data environments. Analysis that spans non-Oracle systems may require additional data preparation or configuration work. |
Analytical Reasoning (◐) | Strong for enterprise dashboards and financial analytics within the Oracle stack. Complex data preparation or modeling may require additional setup outside the platform. |
Governance and Auditability (✓) | Enterprise governance capabilities including role-based access control, data security, and compliance features common in Oracle enterprise deployments. |
Query Accuracy (◐) | Stable reporting when data models are well structured, though analytical accuracy depends on the quality of upstream data preparation and modeling. |
Enterprise Scalability (◐) | Designed for enterprise deployments and large datasets, though integration with non-Oracle environments at scale may require additional configuration. |
How to Choose the Right Tool for Your Finance Stack
The real differences appear on three dimensions finance cannot compromise: the ability to join financial data across systems without manual work, the depth of reasoning that supports root cause analysis, and governance that holds under audit.
Platform | Financial Data Integration | Analytical Reasoning | Governance and Auditability | Query Accuracy | Enterprise Scalability |
|---|---|---|---|---|---|
Genloop | ✓ | ✓ | ✓ | ✓ | ✓ |
ThoughtSpot Spotter | ◐ | ◐ | ✓ | ✓ | ◐ |
Microsoft Power BI | ◐ | ◐ | ◐ | ◐ | ✓ |
Tableau Next | ◐ | ◐ | ◐ | ◐ | ✓ |
SAP BusinessObjects | ◐ | ◐ | ✓ | ✓ | ◐ |
Oracle Analytics Cloud | ◐ | ◐ | ✓ | ◐ | ◐ |
If your stack is already consolidated within the SAP or Oracle ecosystem and your financial reporting requirements are well-defined and largely static, BusinessObjects or Oracle Analytics Cloud will hold up.
If you are on Microsoft or Salesforce infrastructure and need broad business user access to pre-built dashboards and reports, Power BI or Tableau Next cover most of that ground.
If your CFO is asking questions that cross systems, require multi-step root cause analysis, and need a clean audit trail at close, Genloop is the right fit.
Finance cannot run on pretty charts. The stack that closes books and answers "why" in the same step is the one worth building around.
Frequently Asked Questions
What is Genloop and how does it work for financial analytics?
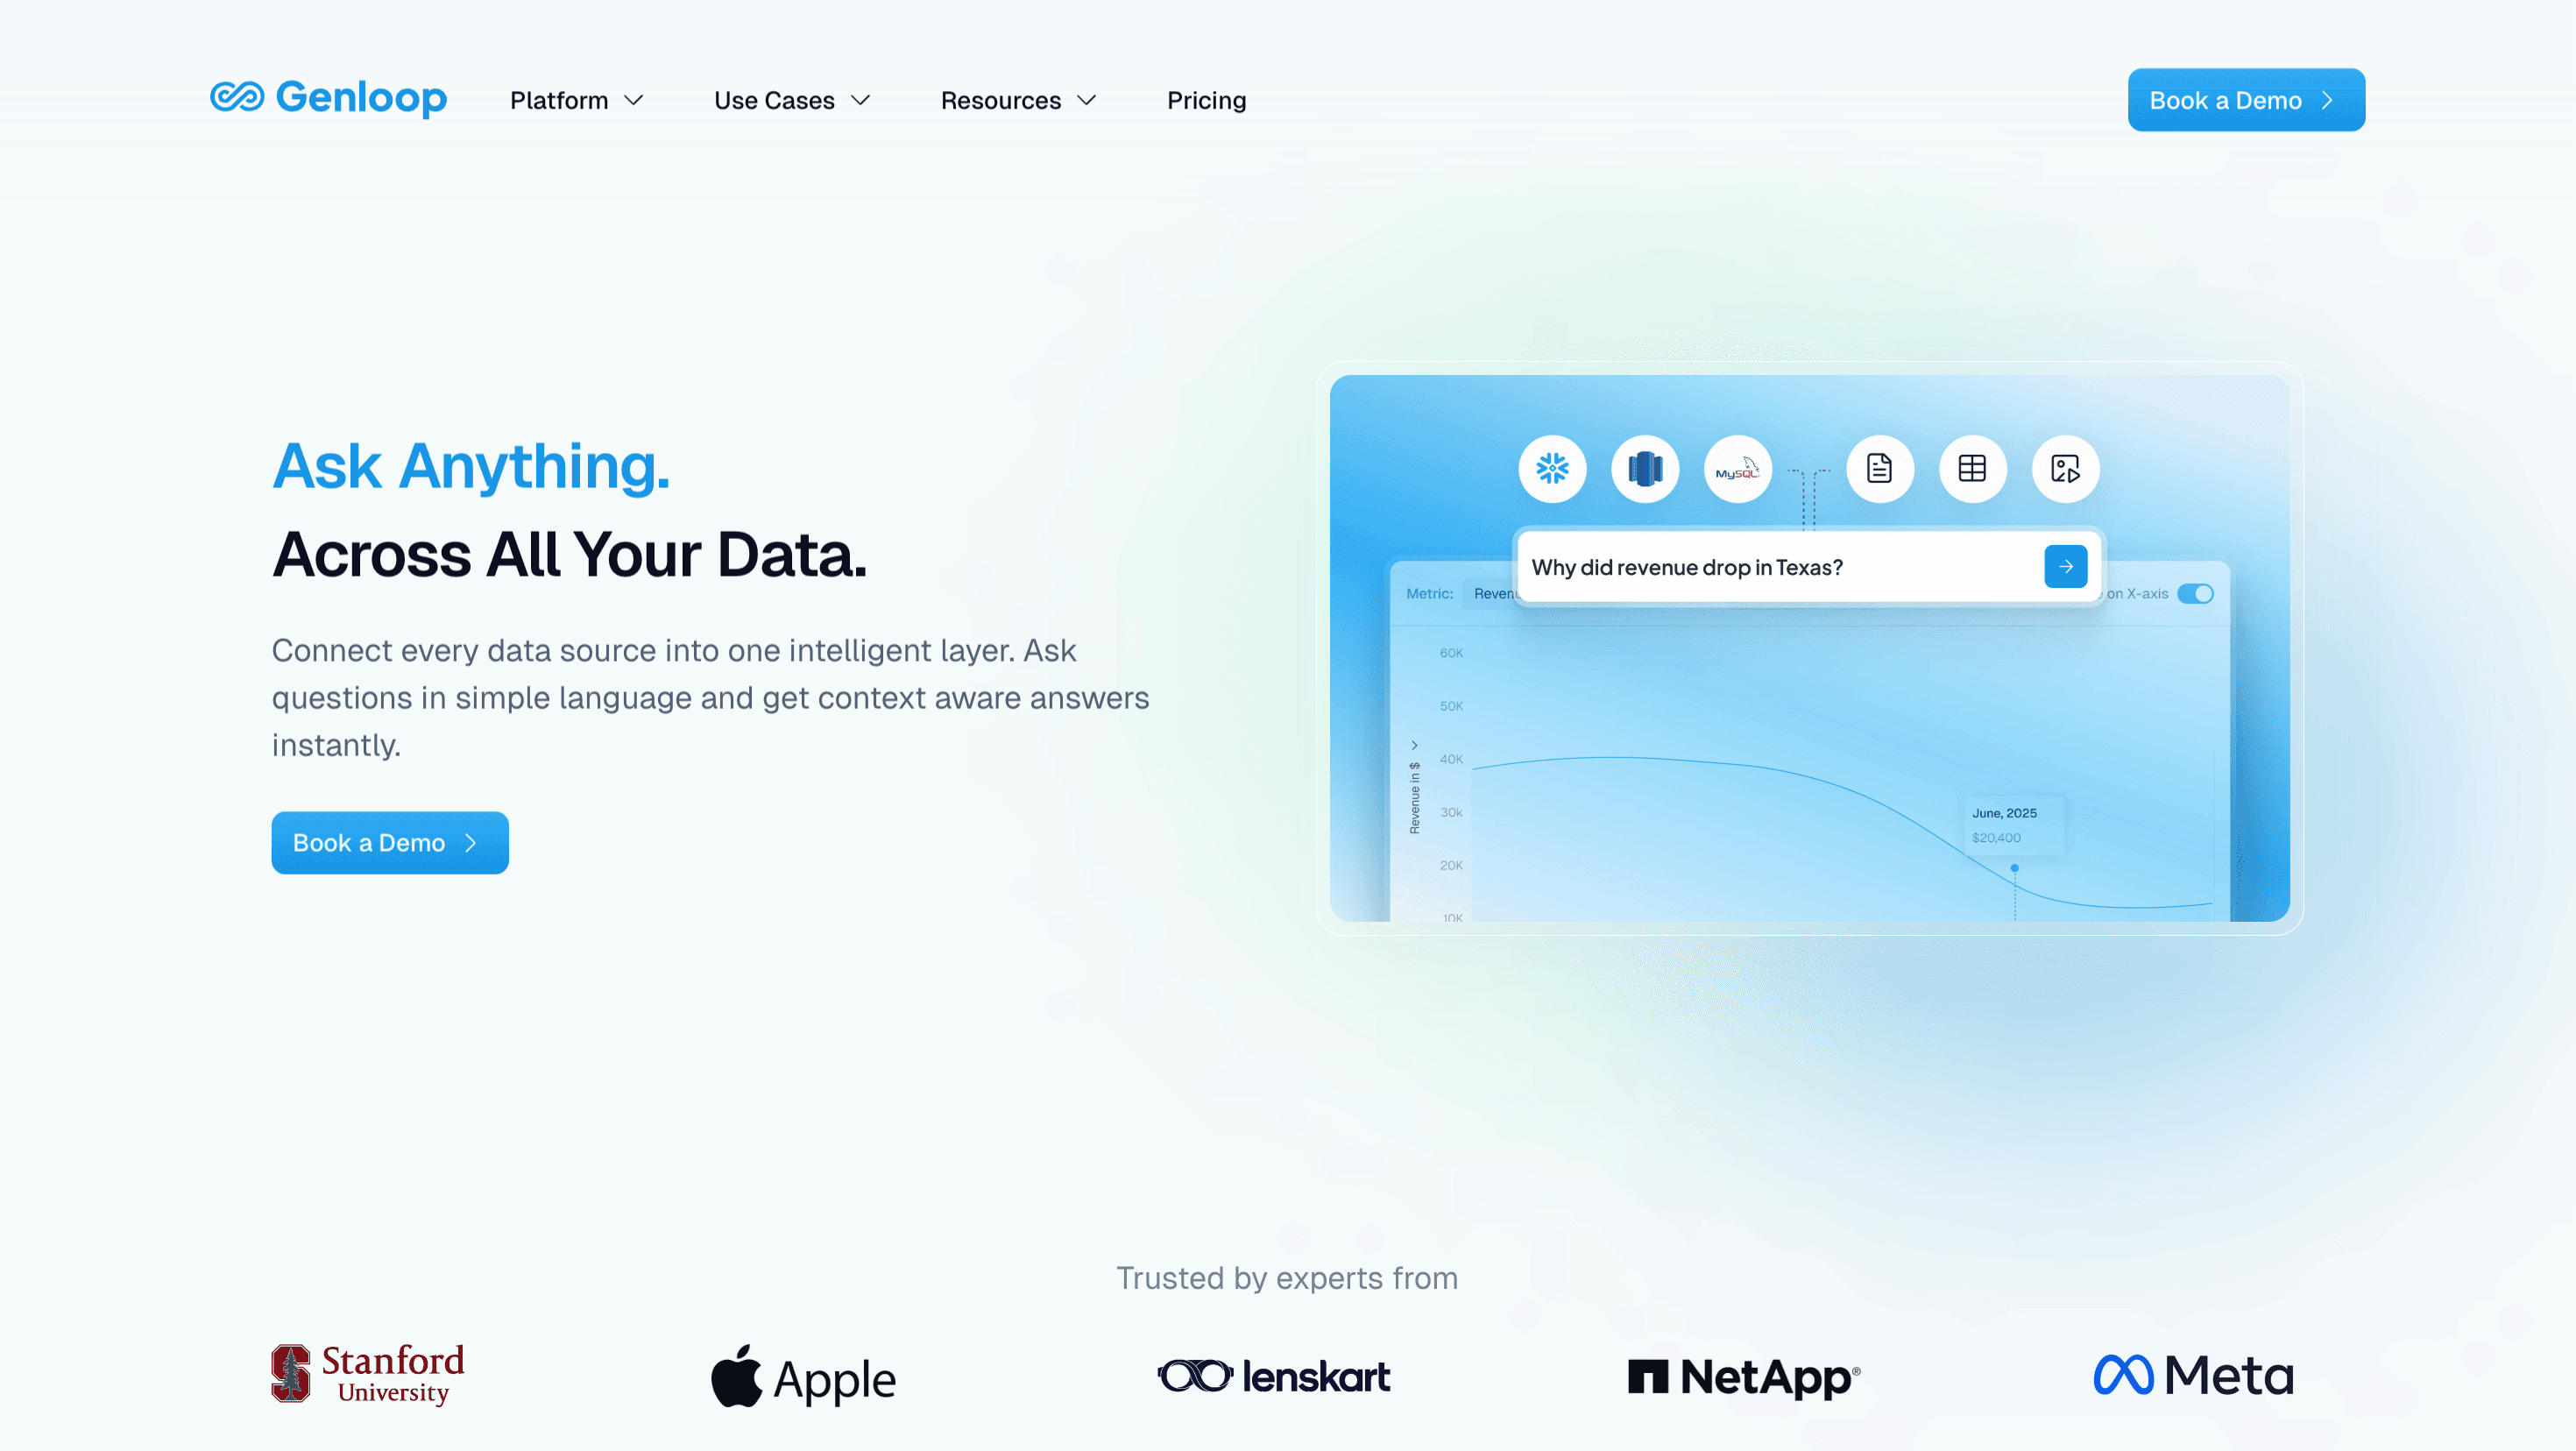
Genloop is a agentic analytics platform designed to help finance teams analyze data across multiple systems using natural language. It connects directly to enterprise data sources and allows users to ask questions about financial performance, trends, and anomalies without exporting data or building reports in advance. The platform is built specifically for investigative workflows: understanding why metrics changed, not just visualizing that they did.
How is Genloop different from Power BI or Tableau for financial analytics?
Power BI and Tableau are primarily built for dashboards and visual reporting. Their ability to answer complex financial questions depends on pre-built semantic models and analyst-created reports. Genloop supports conversational financial analysis and cross-system investigation, allowing finance teams to explore questions that span multiple data sources without relying on pre-built dashboards. For a longer look at the difference, see Traditional BI vs Conversational Analytics.
Can Genloop analyze financial data across multiple systems?
Yes. Genloop is designed to analyze financial data that exists across different enterprise systems including data warehouses, ERP platforms, and analytics databases. Finance teams can ask questions that span revenue systems, cost centers, and operational data without manually combining reports.
Why do finance teams use Genloop instead of traditional BI dashboards?
Finance teams need to understand not just what happened in the numbers, but why. Dashboards show trends and KPIs. Deeper financial investigation typically requires analysts to run multiple queries across systems and reconcile the results manually. Genloop supports this investigative workflow directly: users can ask follow-up questions and trace root causes without leaving the analytics interface. Book a demo to see it run on real enterprise financial data.
Can Genloop support audit-ready financial analysis?
Genloop answers financial questions using controlled data sources and defined business logic stored in Unified Business Memory. Every query step is traceable, metric definitions are governed, and access controls are enforced at the execution layer. This gives finance and audit teams a consistent record of how financial results were calculated, which matters at close and during compliance reviews.