Most sales forecasts are wrong for the same reason. The data that would have caught the problem existed, but it was sitting in three different systems, and nobody joined it in time.
The CRM showed the pipeline stage. Product telemetry showed disengagement. The support queue had two unresolved tickets sitting against the same account. Separately, none of it looks alarming. Together, it is a churned renewal that someone will spend twenty minutes explaining on the next QBR.
This is exactly the gap that sales analytics is supposed to close, and most platforms fall short of it. They cover one data source well and quietly hand the rest off as an integration problem for your data team to solve later.
TLDR
This blog evaluates six platforms on the capabilities that determine whether sales analytics holds up in production:
Revenue Signal Coverage — Whether the platform surfaces signals across CRM, product telemetry, support, and finance, or is limited to one data boundary.
Pipeline Prediction Capability — Whether it can identify at-risk deals and renewal signals before they surface through rep escalation.
Cross-System Sales Data — Whether it federates across data sources at query time, or requires ETL into a shared warehouse first.
Governance of Revenue Metrics — Whether metric definitions are version-controlled and lineage-traced, or depend on analyst documentation to stay accurate.
Operational Scalability — Whether it serves the full revenue org without requiring engineering overhead to expand coverage.
The platforms covered: Genloop, Salesforce CRM Analytics, ThoughtSpot, Tableau, Gong, and Domo.
What Predictive Sales Analytics Actually Requires
Predictive sales analytics is not a smarter dashboard. It is a fundamentally different execution model.
Traditional sales reporting waits for a question someone already built a dashboard for. Predictive analytics has to do more: surface pipeline risk before a rep escalates it, identify renewal signals before churn becomes visible, and connect CRM data, usage telemetry, entitlement history, and support context into a single reasoning surface.
Three architectural components determine whether that works in production:
Semantic consistency: The platform must translate business questions into governed metric definitions, not raw schema guesses. Without this, the same question returns different numbers depending on who runs it.
Cross-source federation: Sales data lives in CRM, product telemetry, finance systems, and support platforms. A platform that joins only two of these delivers a slice, not a prediction.
Deterministic execution: Query plans must be inspectable and repeatable. A system that approximates joins produces confident answers to the wrong question.
Most platforms in this list address one of these well. The gap between them shows up in the other two.
What Each Tool Category Actually Covers
The six platforms here do not all compete for the same budget line. Sales leaders evaluate them together because they all appear in conversations about "getting better answers from sales data." But they solve different parts of that problem:
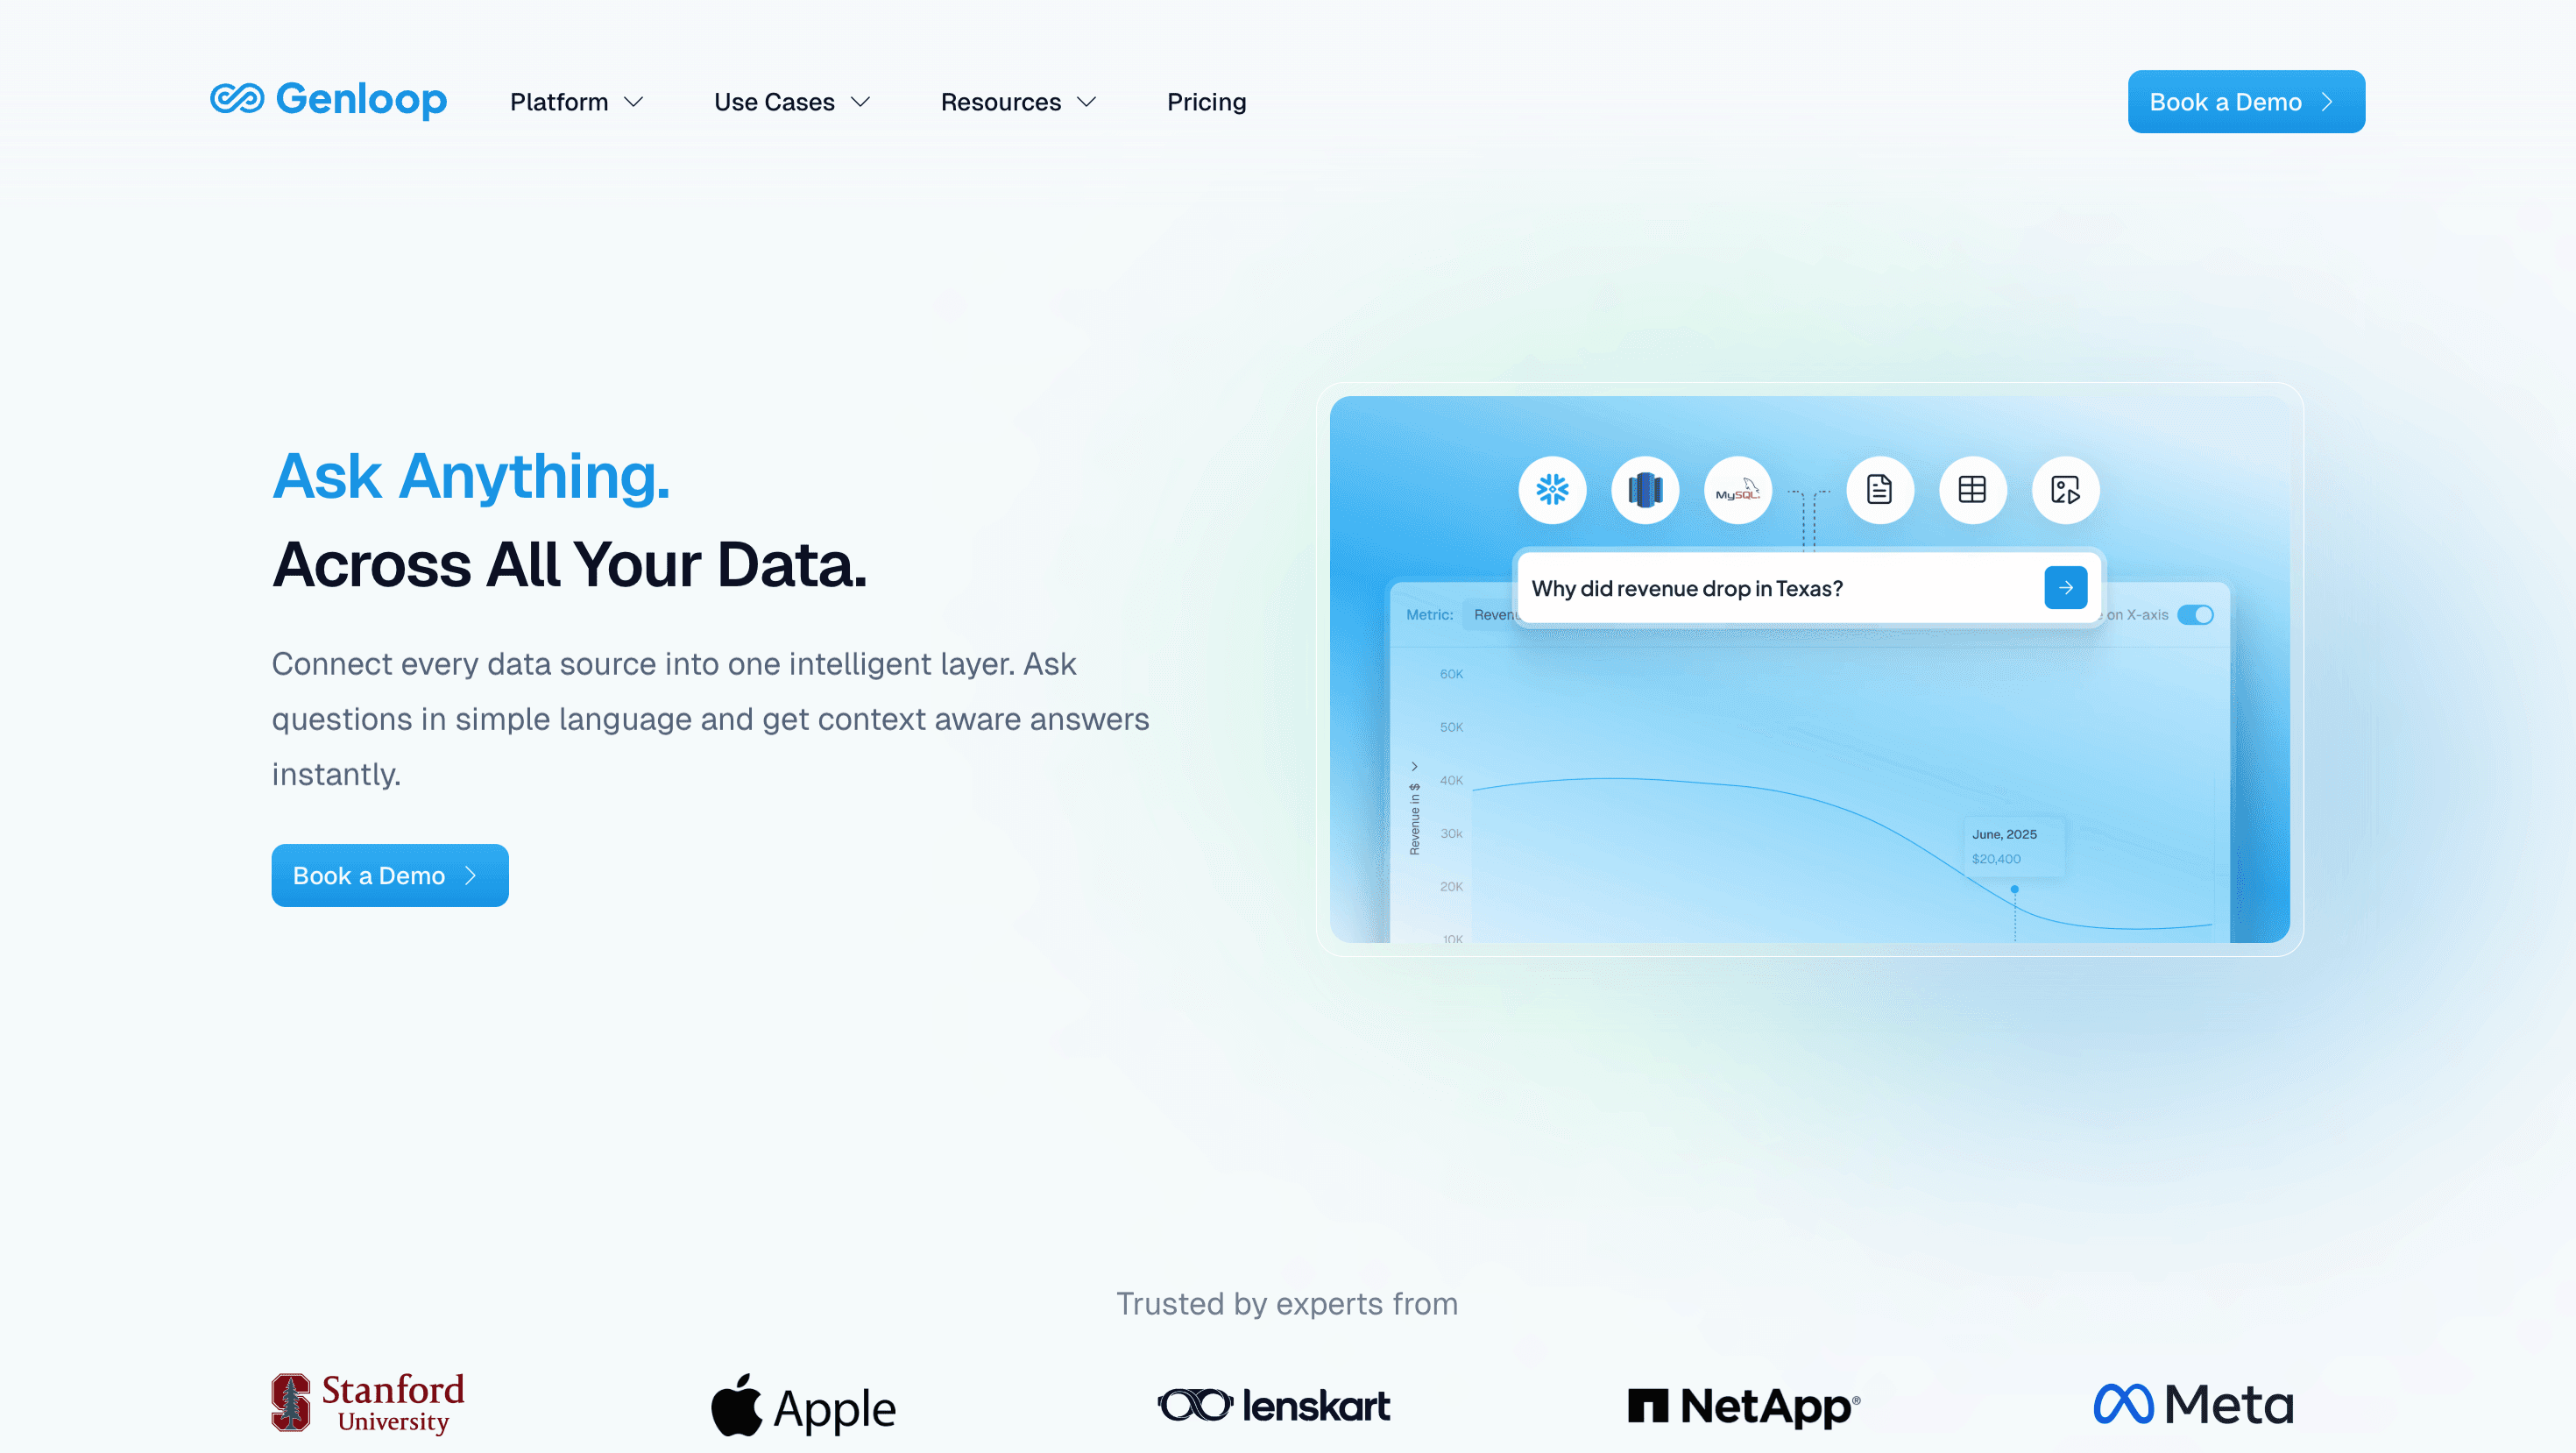
Conversational analytics platforms (Genloop) answer any cross-source business question in natural language with governed execution.
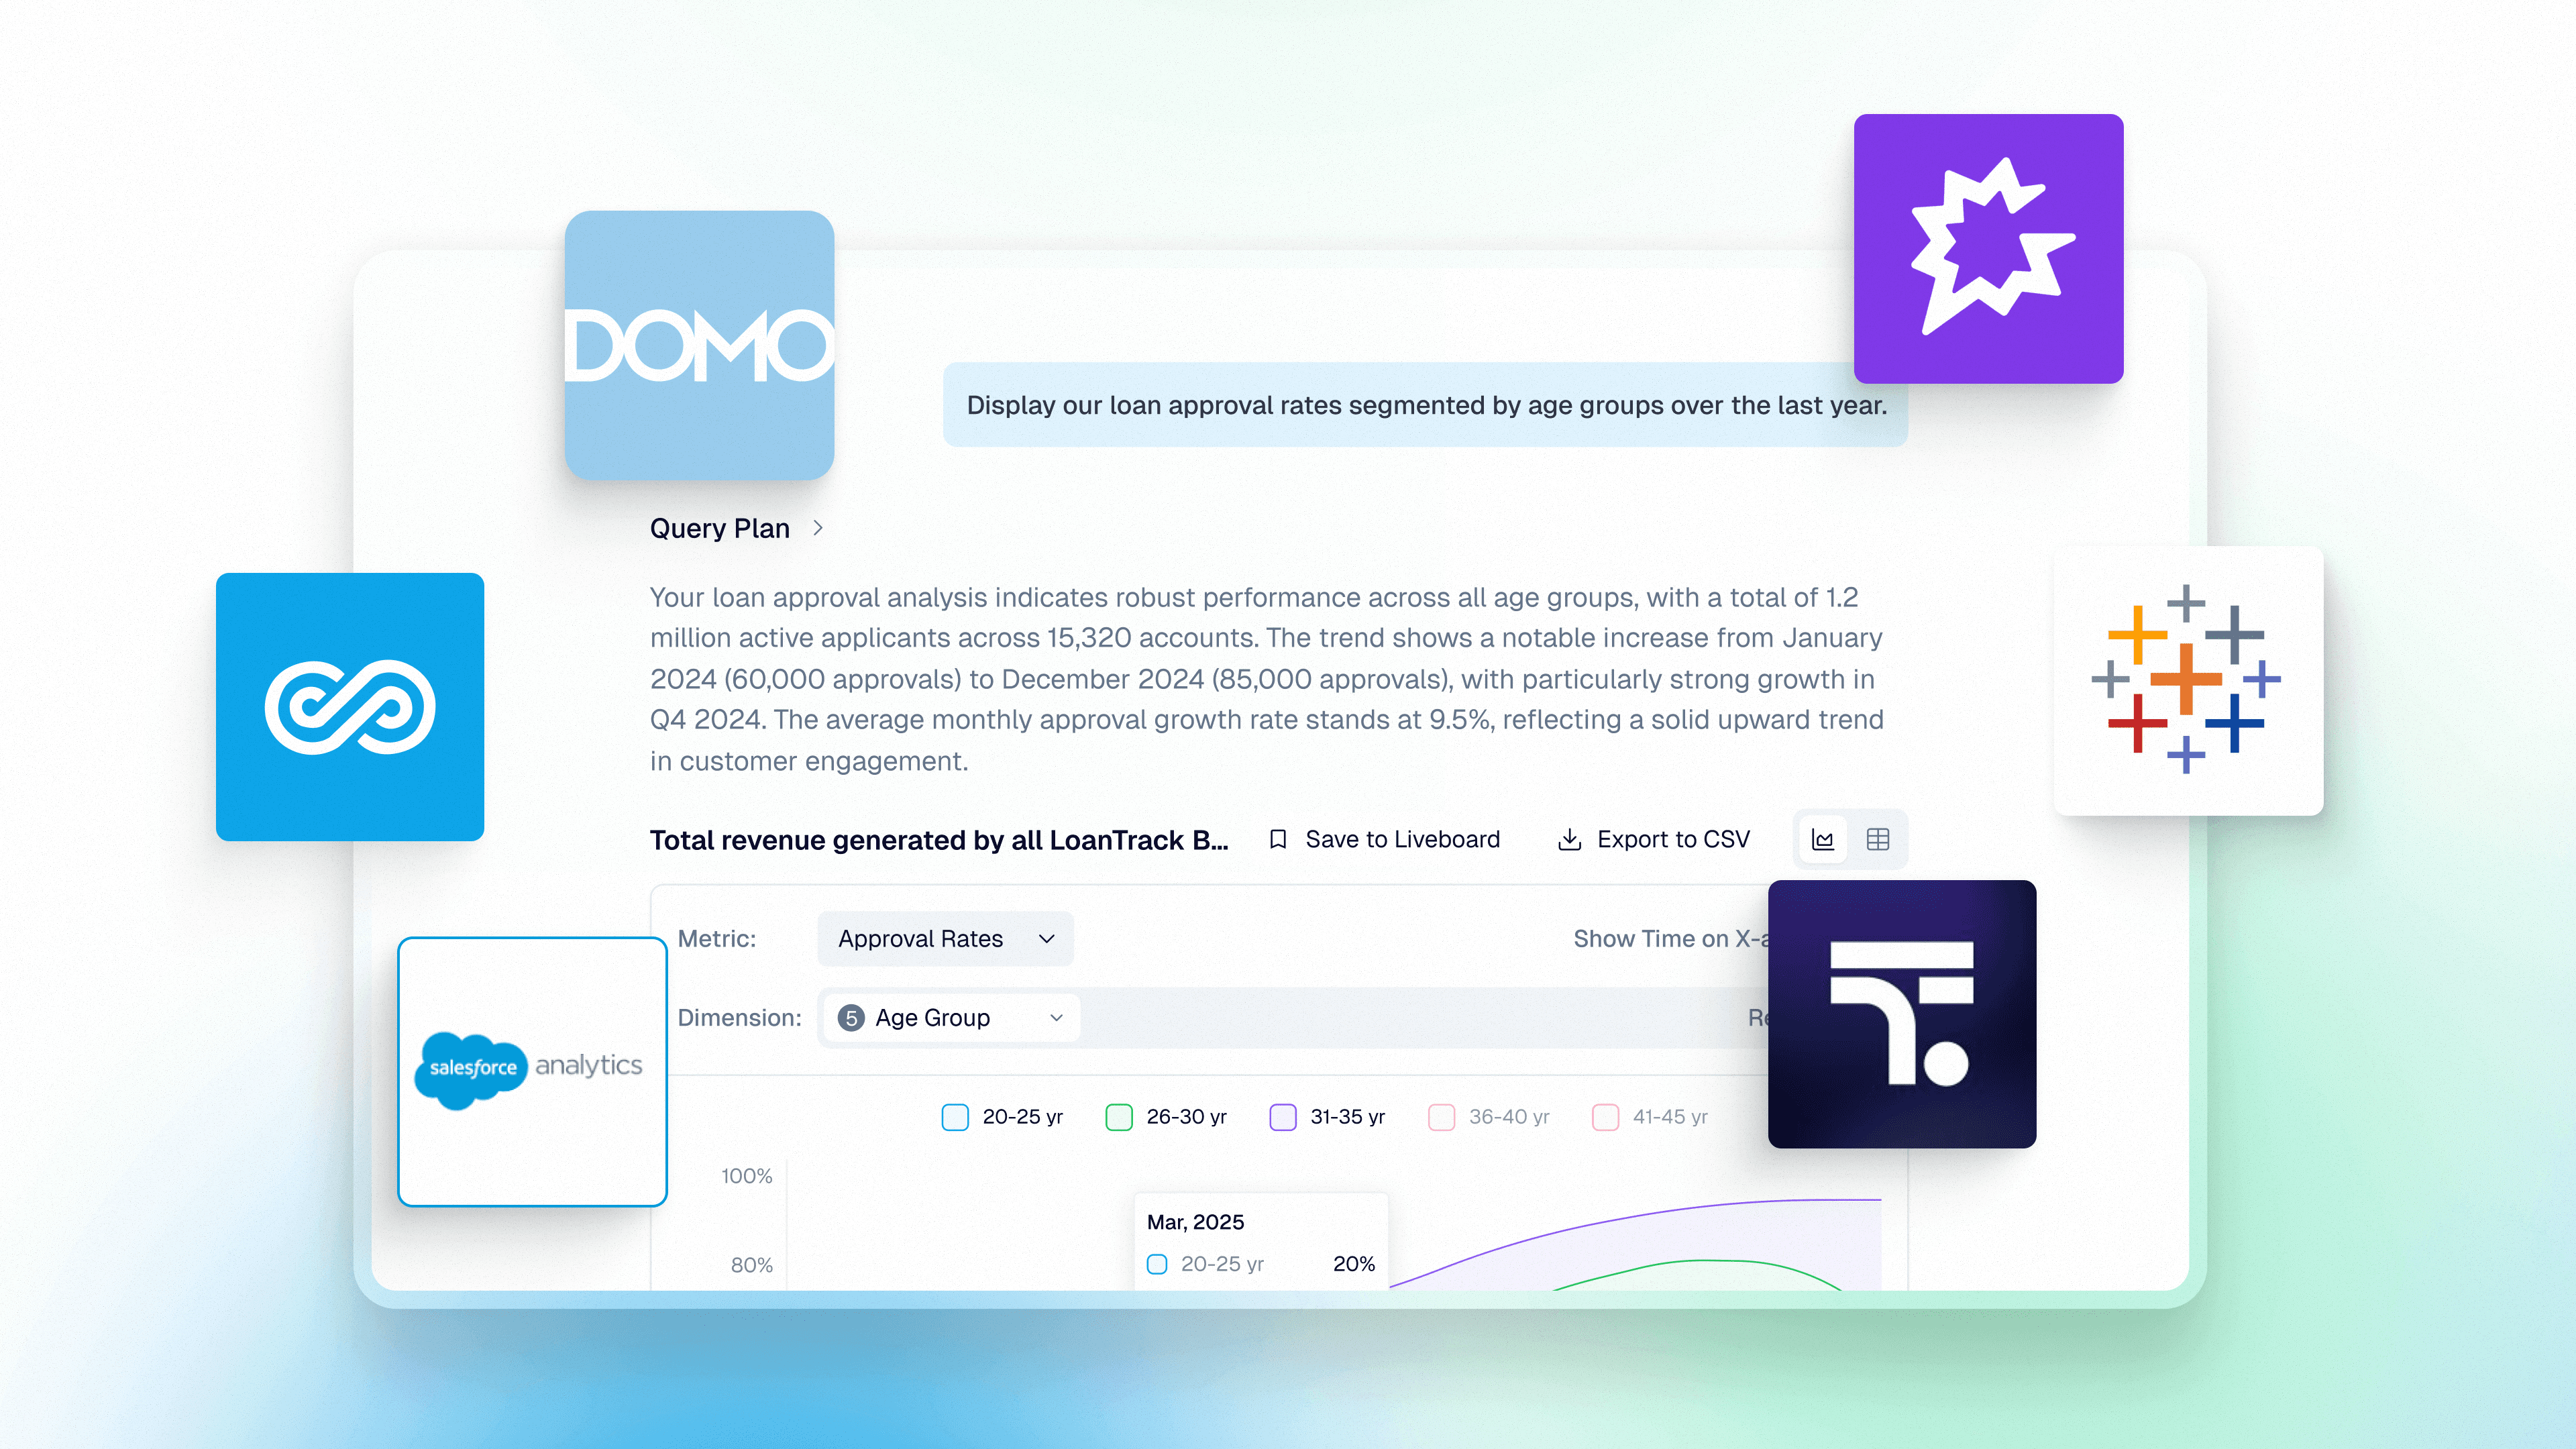
Enterprise BI platforms (ThoughtSpot, Tableau, Domo) visualize and explore data. Depth depends on the semantic model behind them.
CRM analytics add-ons (Salesforce CRM Analytics) provide strong analytics inside the CRM boundary, with constraints outside it.
Conversation intelligence tools (Gong) surface signals from sales calls and rep activity. Not designed for cross-dataset revenue analytics.
Understanding which category each tool belongs to is the first step to avoiding a mismatch between what you buy and what you need.
Top 6 Sales Analytics Platforms in 2026
1. Genloop
Best for: Enterprise revenue teams that need accurate, governed answers across CRM, usage, and financial data without moving data or writing SQL
Genloop is a conversational analytics platform built for enterprise data environments. It scores 96.7% on Spider 2, the most rigorous NL2SQL benchmark available. It builds a multi-modal context graph across sales, product, finance, and support data and continuously refines it with usage. A sales manager can ask "Which enterprise renewals slipped last quarter because of unresolved support tickets?" in plain language and get a governed answer with full metric lineage. No data team ticket required.
Dimension | How Genloop performs |
|---|---|
Revenue Signal Coverage | Builds a multi-modal context graph across CRM, product usage, finance, and support data. Revenue signals are not bounded by a single source or pre-built dashboard. |
Pipeline Prediction Capability | Cross-table reasoning connects pipeline stage, usage telemetry, support history, and entitlement data in a single query, surfacing risk before reps escalate it. |
Cross-System Sales Data | Connects directly to Snowflake, BigQuery, Redshift, PostgreSQL, MySQL, and SQL Server and federates at query time. Data does not move. |
Governance of Revenue Metrics | Every metric traces to source table and column. RBAC and row-level security enforce at query time, not as a post-hoc filter. Unified Business Memory stores all metric definitions in one governed layer. |
Operational Scalability | Unified Business Memory grows with usage. Non-technical sales users self-serve in natural language without analyst intermediation or model updates. |
2. Salesforce CRM Analytics
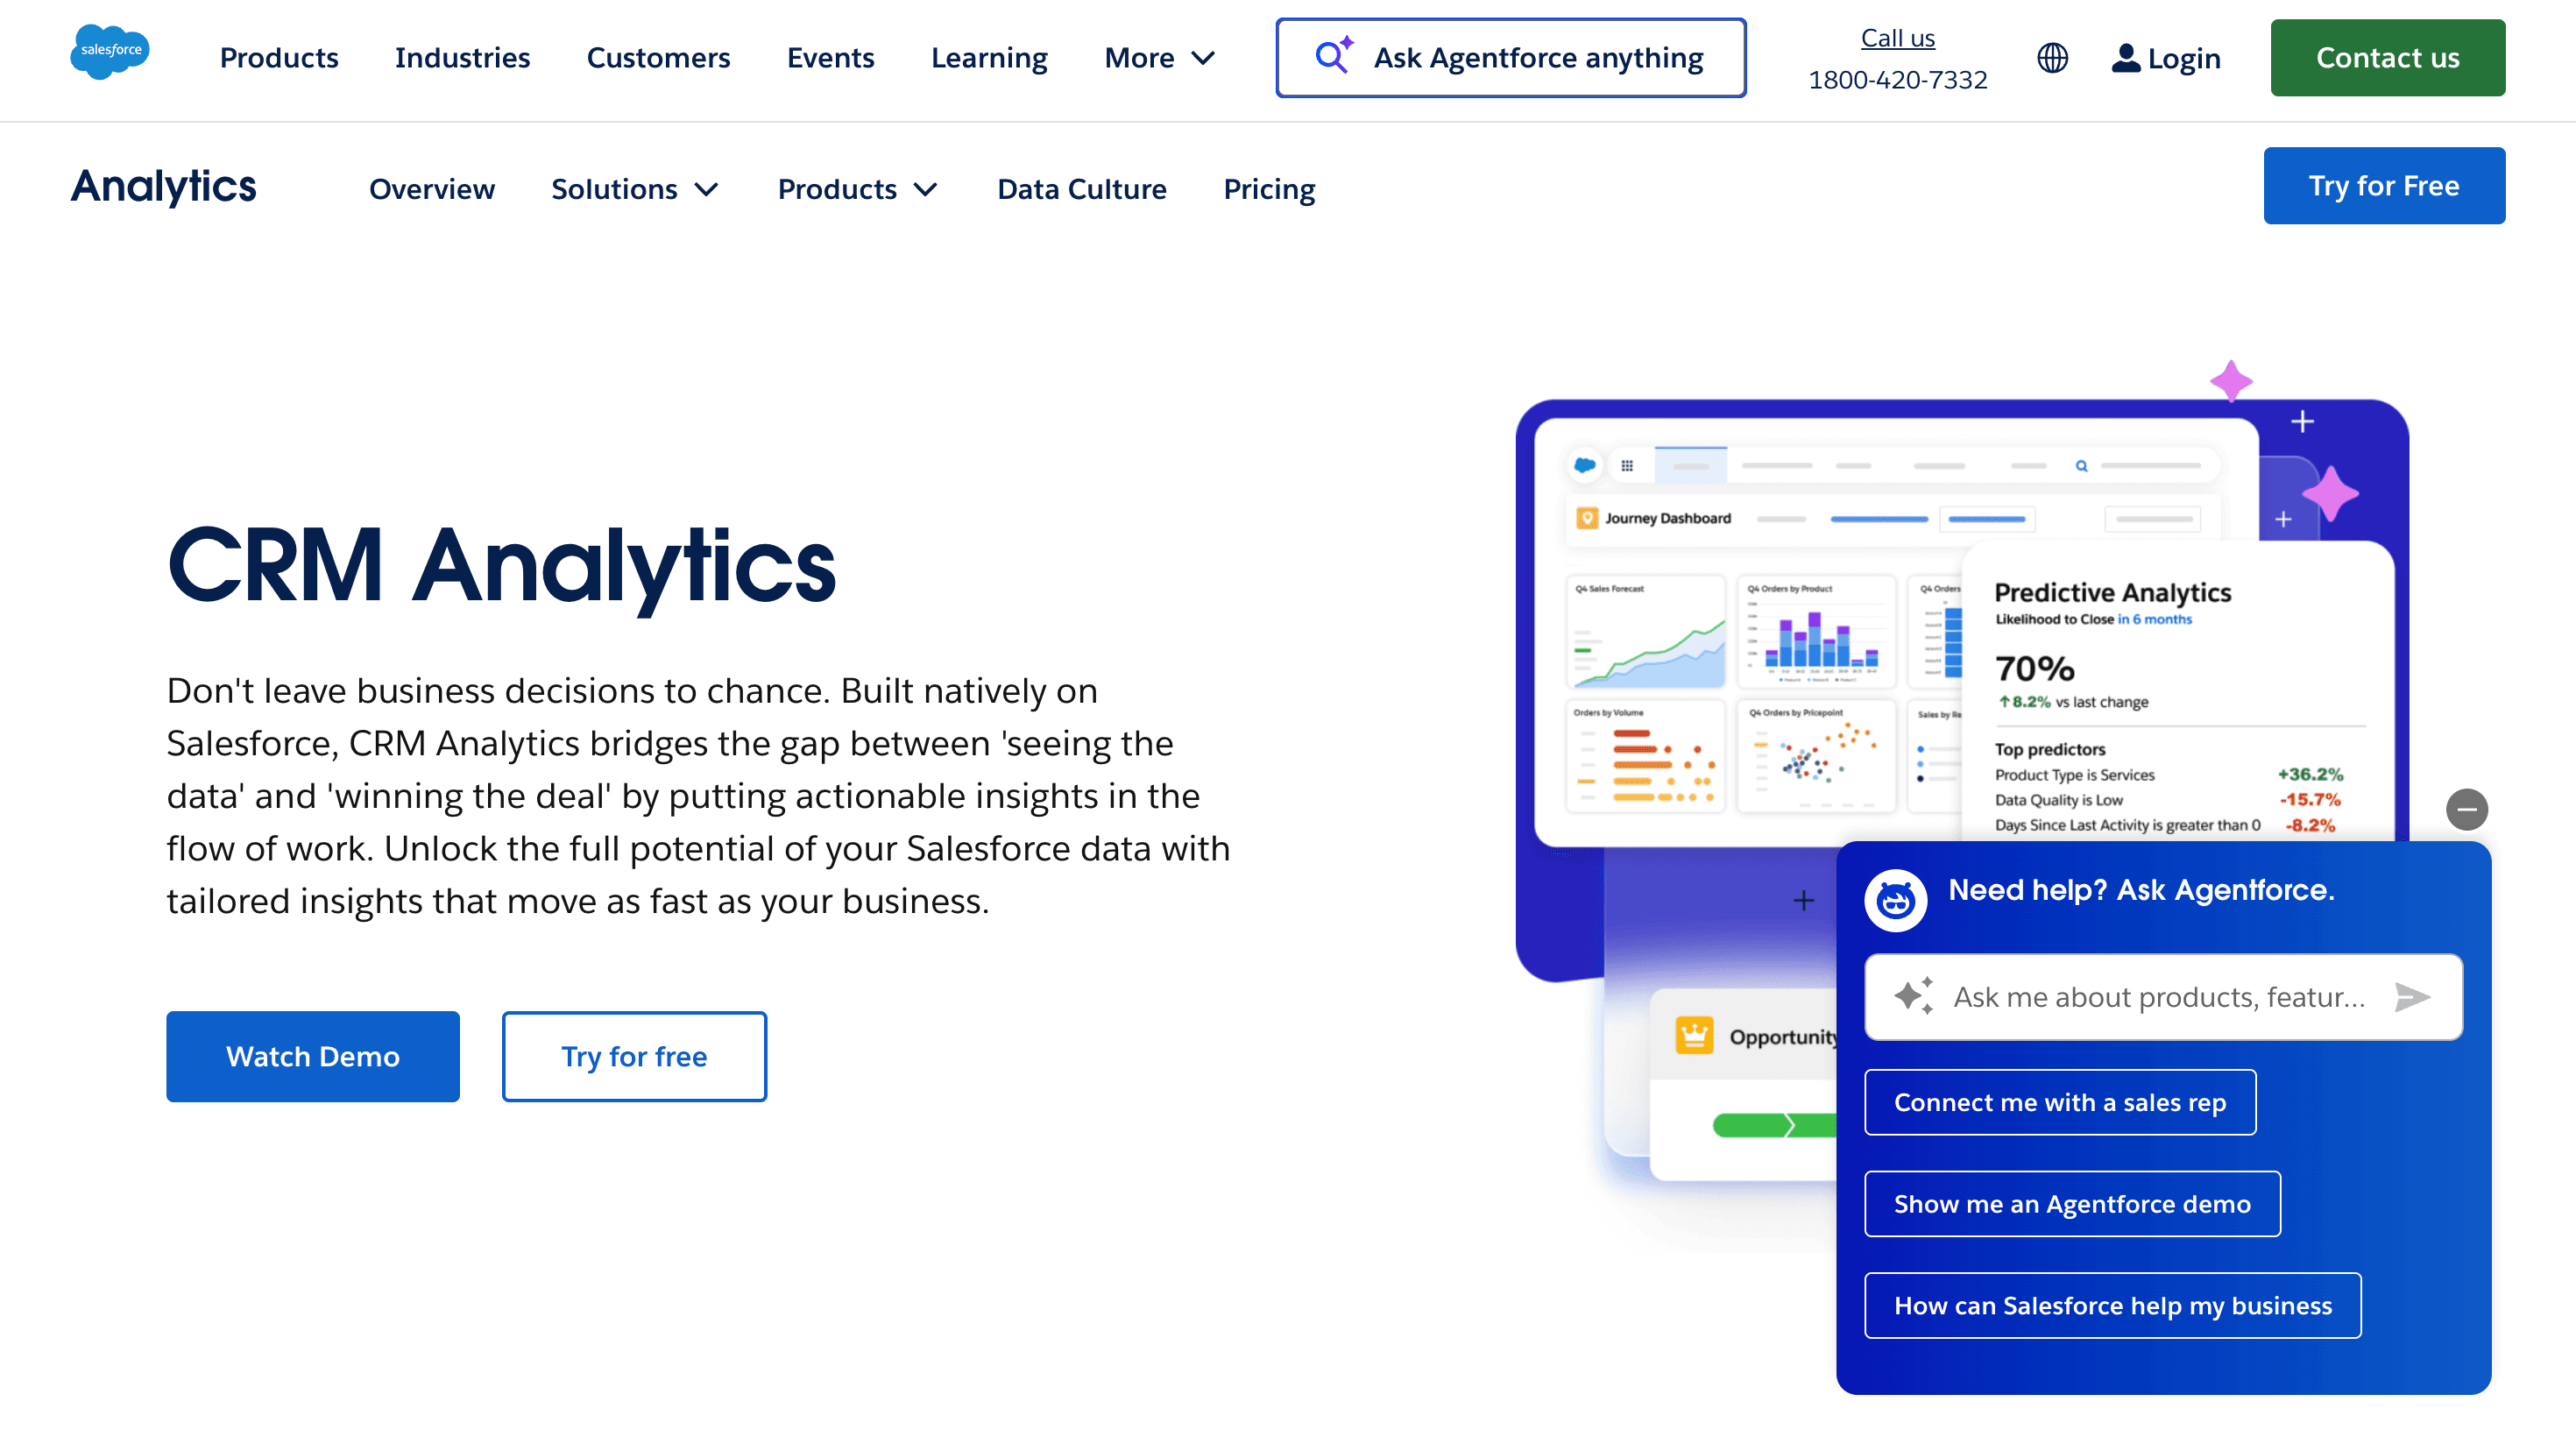
Best for: Revenue teams operating primarily inside Salesforce who can accept data movement costs for external sources
Salesforce CRM Analytics has genuine depth inside the Salesforce data boundary. Opportunity scoring, pipeline inspection, and activity-based forecasting work well when the data model is CRM-native. The constraint appears when external data enters the picture. Usage telemetry, entitlement systems, or product data require ETL into Salesforce or parallel warehouse infrastructure, which adds cost and governance complexity.
Dimension | How Salesforce CRM Analytics performs |
|---|---|
Revenue Signal Coverage | Strong coverage within the Salesforce boundary. Signals from product telemetry, entitlement systems, or support platforms require ETL before they appear. |
Pipeline Prediction Capability | Opportunity scoring and activity-based forecasting work well for CRM-native pipelines. Predictions weaken when deal context lives outside Salesforce. |
Cross-System Sales Data | External data requires ETL into Salesforce or parallel warehouse infrastructure before it can be queried alongside CRM data. |
Governance of Revenue Metrics | Governance is solid within Salesforce. Metric lineage across external sources requires manual documentation outside the platform. |
Operational Scalability | Scales well for Salesforce-centric teams. Multi-source stacks accumulate engineering overhead that compounds as complexity grows. |
3. ThoughtSpot
Best for: Enterprise BI teams that need search-driven analytics on a governed semantic model
ThoughtSpot is a search-first BI platform that resolves typed questions to governed metrics and dimensions. Its Spotter agent extends this into conversational territory. The platform is strongest when the semantic model is well-maintained. Coverage and reliability are bounded by what has been explicitly modeled. Questions that fall outside the semantic layer tend to return best-effort interpretations rather than a clear signal that they cannot be answered.
Dimension | How ThoughtSpot performs |
|---|---|
Revenue Signal Coverage | Coverage is bounded by what has been explicitly modeled in the semantic layer. Signals from domains not yet modeled require a semantic model update before they can be queried. |
Pipeline Prediction Capability | Effective for modeled pipeline metrics. Investigative questions that require reasoning across domains not explicitly defined tend to return best-effort interpretations rather than a clean refusal. |
Cross-System Sales Data | Cross-source queries are possible when the semantic layer spans multiple sources, but coverage depends on ongoing model maintenance. |
Governance of Revenue Metrics | Enterprise governance centers on controlled metric definitions and semantic mappings. Access controls are mature. |
Operational Scalability | Can serve many users, but practical coverage is gated by the ongoing cost of semantic modeling. New question types require new model updates. |
4. Tableau
Best for: Enterprise BI teams with engineering resources to build and maintain governed sales data models
Tableau visualizes anything, provided the underlying data model is sound. For sales analytics, that is a significant caveat. The platform supplies no business context of its own. Joins, metric definitions, and access controls must be built and maintained by data engineers. Teams with mature data organizations can produce high-quality sales dashboards. Teams without that capacity get a powerful visualization shell attached to a fragile export workflow.
Dimension | How Tableau performs |
|---|---|
Revenue Signal Coverage | Coverage reflects the upstream data model, not the platform itself. Tableau supplies no business context, so signal coverage is only as complete as what data engineering has built and maintained. |
Pipeline Prediction Capability | No native predictive capability. Pipeline analysis depends on the quality of pre-built dashboards and the data models feeding them. |
Cross-System Sales Data | Cross-source joins must be defined and maintained upstream. Tableau visualizes the result; it does not federate across systems at query time. |
Governance of Revenue Metrics | Lineage and access control depend entirely on how the underlying model is built. No native enforcement at the visualization layer. |
Operational Scalability | Scales for dashboard delivery at enterprise volume. Self-serve analytics at scale requires significant analyst enablement and ongoing model maintenance investment. |
5. Gong
Best for: Sales teams that need conversation intelligence and deal risk signals from rep activity and call data
Gong is a conversation intelligence platform. It records sales calls, surfaces deal risks from transcript analysis, tracks rep engagement patterns, and flags competitor mentions across the sales cycle. It is not a cross-dataset analytics platform and is not designed to be one. Sales leaders include it in this evaluation because it answers a real question: what is happening in deals right now, based on what reps are actually saying and doing.
Dimension | How Gong performs |
|---|---|
Revenue Signal Coverage | Best-in-class for conversation-derived signals from calls, rep activity, and competitor mentions. Not designed to surface signals from CRM, product, or finance data. |
Pipeline Prediction Capability | Surfaces deal risk from transcript analysis and engagement patterns. Does not predict pipeline outcomes using cross-dataset reasoning across CRM, usage, or entitlement data. |
Cross-System Sales Data | Operates on call and activity data. Cross-system queries that require joining CRM, product telemetry, or finance records are outside its scope. |
Governance of Revenue Metrics | AI-derived deal risk scores are not exposed with full metric lineage. Call recording and transcript data carry separate compliance requirements. |
Operational Scalability | Scales well for call volume and rep activity tracking. Does not scale to enterprise revenue analytics without a complementary BI or analytics platform. |
6. Domo
Best for: Mid-market teams that want connectors, transformation, and dashboards consolidated in a single platform
Domo positions as all-in-one: data connectors, ETL, and BI in one product. For teams that do not want to assemble a modern data stack, the consolidated architecture simplifies deployment. The trade-off is depth per layer. Connector breadth is strong. Analytical depth and agentic capabilities are shallower than purpose-built platforms, and consumption-based pricing can create cost unpredictability at enterprise scale.
Dimension | How Domo performs |
|---|---|
Revenue Signal Coverage | Broad connector coverage across sources. Analytical depth per layer is shallower than purpose-built platforms, which limits how far revenue signals can be interrogated. |
Pipeline Prediction Capability | Dashboard-driven pipeline visibility without native predictive or conversational analytics capability. Predictions require custom ETL and modeling work. |
Cross-System Sales Data | Strong connector breadth. Cross-system joins still require ETL through Domo's transformation layer before queries can run across sources. |
Governance of Revenue Metrics | Governance patterns are typical of mid-market BI platforms. Depth of access controls varies by deployment and configuration rigor. |
Operational Scalability | Consumption-based pricing produces cost spikes at high data volumes or user concurrency that are difficult to forecast or control. |
How to Choose
Platform | Revenue Signal Coverage | Pipeline Prediction | Cross-System Sales Data | Governance of Revenue Metrics | Operational Scalability |
|---|---|---|---|---|---|
Genloop | ✓ | ✓ | ✓ | ✓ | ✓ |
Salesforce CRM Analytics | ✓ | ✓ | ◐ | ✓ | ✓ |
ThoughtSpot | ◐ | ◐ | ✓ | ✓ | ✓ |
Tableau | ◐ | ◐ | ✓ | ✓ | ✓ |
Gong | ✓ | ✓ | ◐ | ◐ | ◐ |
Domo | ✓ | ◐ | ✓ | ✓ | ◐ |
The pattern across every partial-fit platform is the same. Capability is conditional: the data has to be in the right place, the model has to be maintained, engineering capacity has to be available, and the question has to fall inside a pre-built framework. In production, those conditions are rarely all true at once.
Revenue signal coverage that stops at the CRM boundary is not coverage. Pipeline prediction that depends on a dashboard someone built last quarter is not prediction. Cross-system joins that require ETL before they can run add latency to every answer your sales org needs today.
The platform that closes the gap between a revenue question and a governed, cross-source answer is the one that changes what your forecast is actually worth.
FAQs
What is conversational analytics in sales?
Conversational analytics lets sales teams ask questions about revenue data in natural language instead of navigating dashboards. Platforms like Genloop translate these questions into governed queries so answers match the company’s metric definitions.
How is conversational analytics different from traditional sales dashboards?
Dashboards show predefined metrics built by analysts. Conversational analytics lets users ask new questions directly. Tools like Genloop convert natural language queries into structured analysis across business data.
Can AI replace sales analytics dashboards?
No. Dashboards are still useful for monitoring fixed metrics like pipeline coverage or quota attainment. Conversational analytics platforms such as Genloop complement dashboards by answering new questions without building new reports.
What data sources are used for sales analytics?
Sales analytics typically combines CRM data, product usage data, billing systems, support platforms, and marketing tools. Platforms like Genloop analyze these sources together using a unified semantic layer.
How accurate are AI-powered sales analytics tools?
Accuracy depends on whether queries run directly on data sources or rely on probabilistic responses. Platforms like Genloop execute deterministic queries and expose query lineage for verification.
What should I look for in a conversational analytics platform?
Look for strong data connectivity, governance, semantic consistency, and query traceability. Platforms such as Genloop enforce shared metric definitions and row-level security across queries.
How do sales teams use conversational analytics daily?
Sales teams use conversational analytics to investigate pipeline changes, detect churn risk, analyze deal progression, and identify expansion opportunities. Platforms like Genloop allow managers to ask these questions directly.
Can conversational analytics support revenue forecasting?
Yes. Conversational analytics platforms like Genloop use governed metric definitions and historical pipeline data to support accurate revenue forecasting.