Tableau is a visualization layer. It takes data someone else prepared, in a model someone else built, and renders it as a chart a business user can look at. That architecture has been the default for fifteen years.
The platforms replacing it fall into two camps. Most are still visualization layers, a handful are replacing the architecture itself: governed reasoning engines that let business users query data directly, skip the dashboard entirely, and get answers instead of charts.
TLDR
This blog evaluates Tableau alternatives based on the architectural capabilities that determine whether modern analytics platforms work reliably in production environments:
Analytical Depth — The platform’s ability to answer complex business questions through multi-step analysis instead of only visualizing dashboards.
Data Source Connectivity — The ability to connect and query data across warehouses, databases, and SaaS platforms without requiring extensive data movement.
Self-Service Accessibility — How easily business users can explore and analyze data without writing SQL or relying on analysts to build dashboards.
Governance and Data Trust — Whether the platform enforces consistent metric definitions, access controls, and traceable query execution.
Operational Cost — The total cost of operating the analytics platform including licensing, infrastructure, compute usage, and administrative overhead.
Why Most Tableau Alternatives Fail After the Pilot
The demo is always fast because vendors preload a trimmed dataset. Real enterprise deployments bring three constraints that break legacy architectures immediately.
Heterogeneous sources: Finance runs on Snowflake. Operations still has Postgres tables. Forcing teams to copy data into a proprietary storage layer adds latency, risk, and a data engineering task queue that never clears.
Concurrent ad hoc questions: Finance drills into variance while Marketing asks for cohort churn. Architectures that serialize requests stall dashboards at exactly the moment adoption depends on speed.
Governance friction: Legal needs column-level lineage. Security needs row-level policies that travel with the data, not SQL views that data engineers build on request. Platforms that treat governance as a configuration task rather than a core execution layer fail this one quietly.
Vendors built around dashboard rendering fail all three. This is the same architectural gap we covered in our breakdown of why Traditional BI struggles to answer new questions without dashboards.
1. Genloop
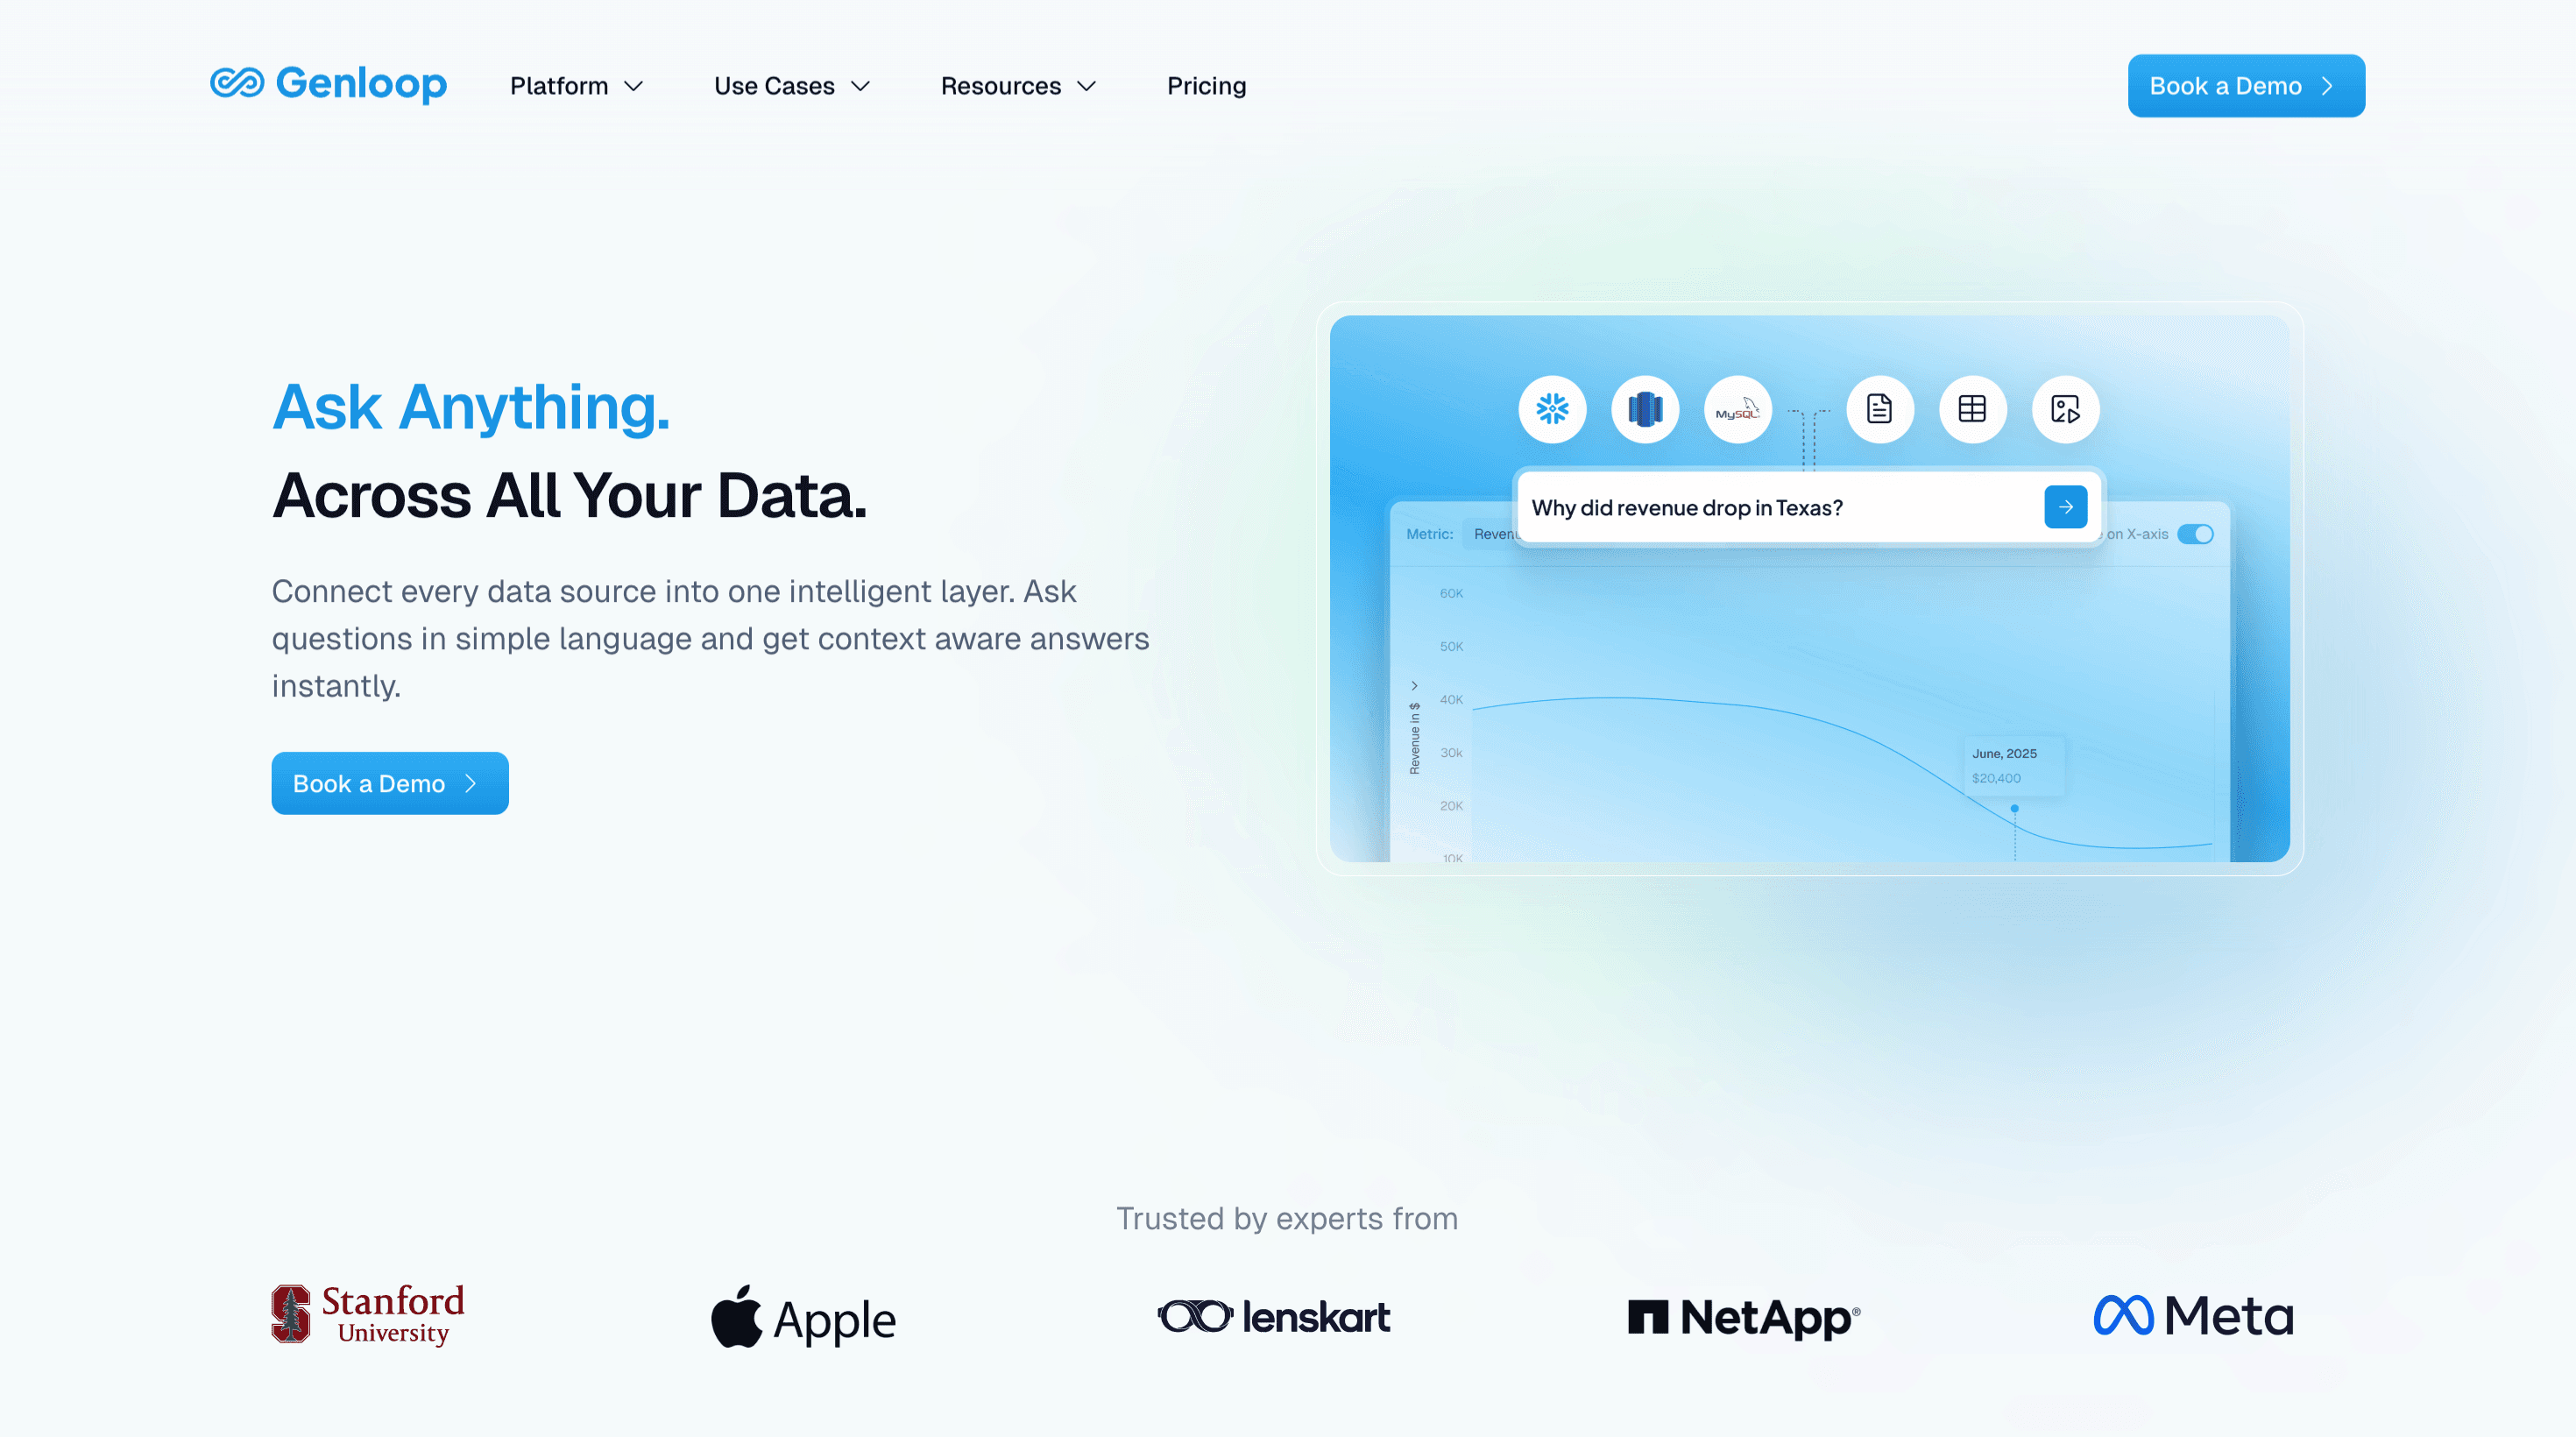
Genloop scores 96.7% on the Spider 2 benchmark, making it the most accurate data reasoning platform available. It is a platform that builds a multi-modal enterprise context graph of the enterprise and continuously refines it with usage. Where Tableau requires a data engineer to update a model or build a new dashboard for each new business question, Genloop stores business logic, metric definitions, team context, and join logic in a single governed layer called Unified Business Memory. Business users get direct answers in plain English. The BI reporting backlog doesn't migrate from Tableau to Genloop. It stops.
A new category of tools is emerging around this pattern. We covered the broader field in our breakdown of the top tools for agentic data analysis in 2026.
Dimension | Genloop Capability |
|---|---|
Analytical Depth | Answers complex, multi-step business questions through specialized reasoning agents. Supports prescriptive analysis and decision automation, not just visualization. Built specifically to handle long-tail questions that break traditional platforms. |
Data Source Connectivity | Connects directly to Snowflake, BigQuery, Redshift, PostgreSQL, MySQL, and SQL Server. Queries live sources without requiring data movement or proprietary extract layers. Multi-modal context graph maps relationships across all connected sources automatically. |
Self-Service Accessibility | Plain English is the primary interface. Business users ask questions and get governed answers without writing SQL or waiting for analysts to build dashboards. Genloop's reliability engine flags uncertain answers before surfacing them, so self-service doesn't trade speed for accuracy. |
Governance and Data Trust | Every query executes against the Unified Business Memory layer, which enforces metric definitions, RBAC, and row-level and column-level security natively. Full decision traceability is built into every answer, not added as an audit log. |
Operational Cost | Distilled task-specific models keep per-question compute predictable at scale. No proprietary extract storage. No data engineering overhead to maintain the semantic layer. Token economics are optimized for high-volume enterprise usage, not one-off demos. |
2. Looker
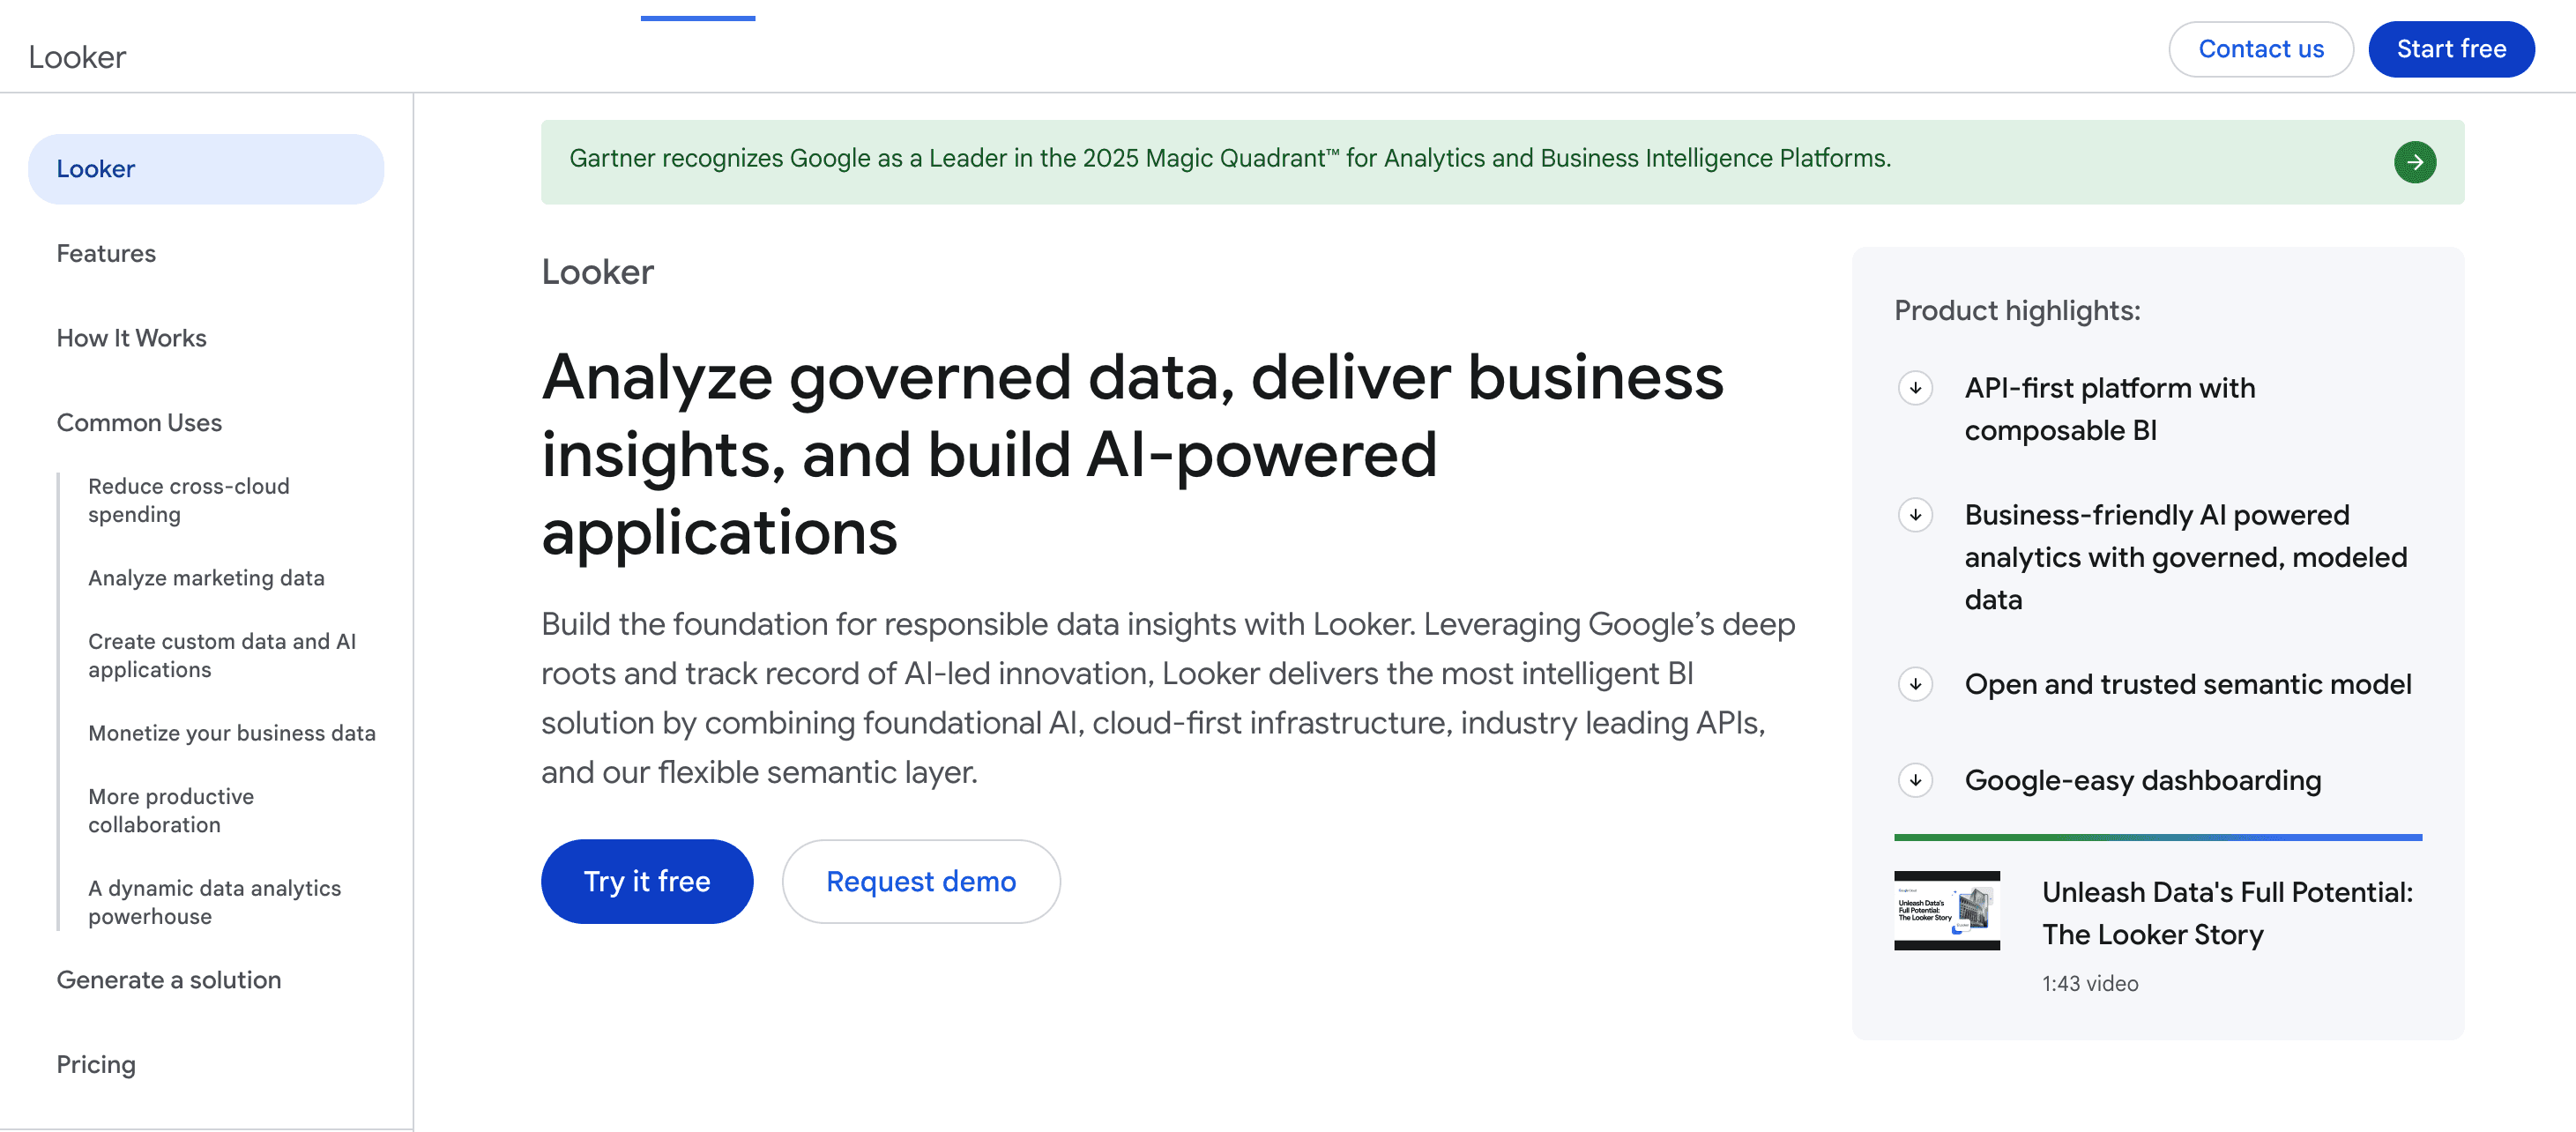
Looker pioneered the centralized semantic layer, enforcing all business logic in version-controlled LookML before any visual is rendered. It is a strong governance platform with real scale. The cost structure is the primary constraint.
Dimension | Looker |
|---|---|
Analytical Depth | Solid for governed reporting. Does not support autonomous multi-step reasoning or prescriptive analysis beyond what analysts define in LookML in advance. |
Data Source Connectivity | Queries run directly against cloud data warehouses. Native connectors cover major platforms but expanding coverage requires LookML development. |
Self-Service Accessibility | Users explore within the bounds of what has been modeled. Questions that fall outside the existing LookML definitions require analyst intervention. |
Governance and Data Trust | Strong. Granular RBAC, strict version control, and metric consistency enforced at the semantic layer across all access paths. |
Operational Cost | High. Platform fees, user licenses, and underlying warehouse compute costs compound at enterprise scale with no optimized token economics. |
3. Power BI
Power BI is the most widely deployed BI platform globally, with deep integration across the Microsoft stack. Natural language and AI features are available but sit on top of a traditional dashboard architecture rather than replacing it.
Dimension | Power BI |
|---|---|
Analytical Depth | Covers standard reporting well. Complex analysis requires DAX coding and semantic model investment from analysts. AI features like Copilot depend heavily on how well the underlying model was built manually. |
Data Source Connectivity | Broad connector coverage across Microsoft and third-party sources. Some connectors push data into proprietary storage rather than querying live, which adds refresh latency. |
Self-Service Accessibility | Familiar to Excel users, which lowers adoption friction in Microsoft-standardized organizations. Natural language Q&A covers common questions but breaks on complex or unusual phrasing. |
Governance and Data Trust | Integrates with Microsoft Purview. Governance can become fragmented across disjointed workspaces and datasets at enterprise scale without careful administration. |
Operational Cost | Pro licenses start low. Total cost increases quickly once enterprise Fabric capacities are required for complex or high-concurrency workloads. |
4. Qlik Sense
Qlik's associative engine indexes relationships across data without requiring pre-defined SQL joins, which makes it useful for exploratory analysis where the query path isn't known in advance.
Dimension | Qlik Sense |
|---|---|
Analytical Depth | The associative engine supports flexible data discovery. Does not provide autonomous reasoning, prescriptive analysis, or multi-step decision automation. |
Data Source Connectivity | Broad connectors available. In-memory processing means large datasets require significant infrastructure planning before queries remain fast. |
Self-Service Accessibility | Better than traditional BI for exploration without pre-built dashboards. Still requires analysts to build the data model that business users navigate. |
Governance and Data Trust | Governance relies on script-based access controls. Lacks dynamic decision traceability required in complex enterprise compliance environments. |
Operational Cost | Capacity-based pricing tied to data volume becomes unpredictable as the data footprint grows across teams. |
5. Sigma Computing
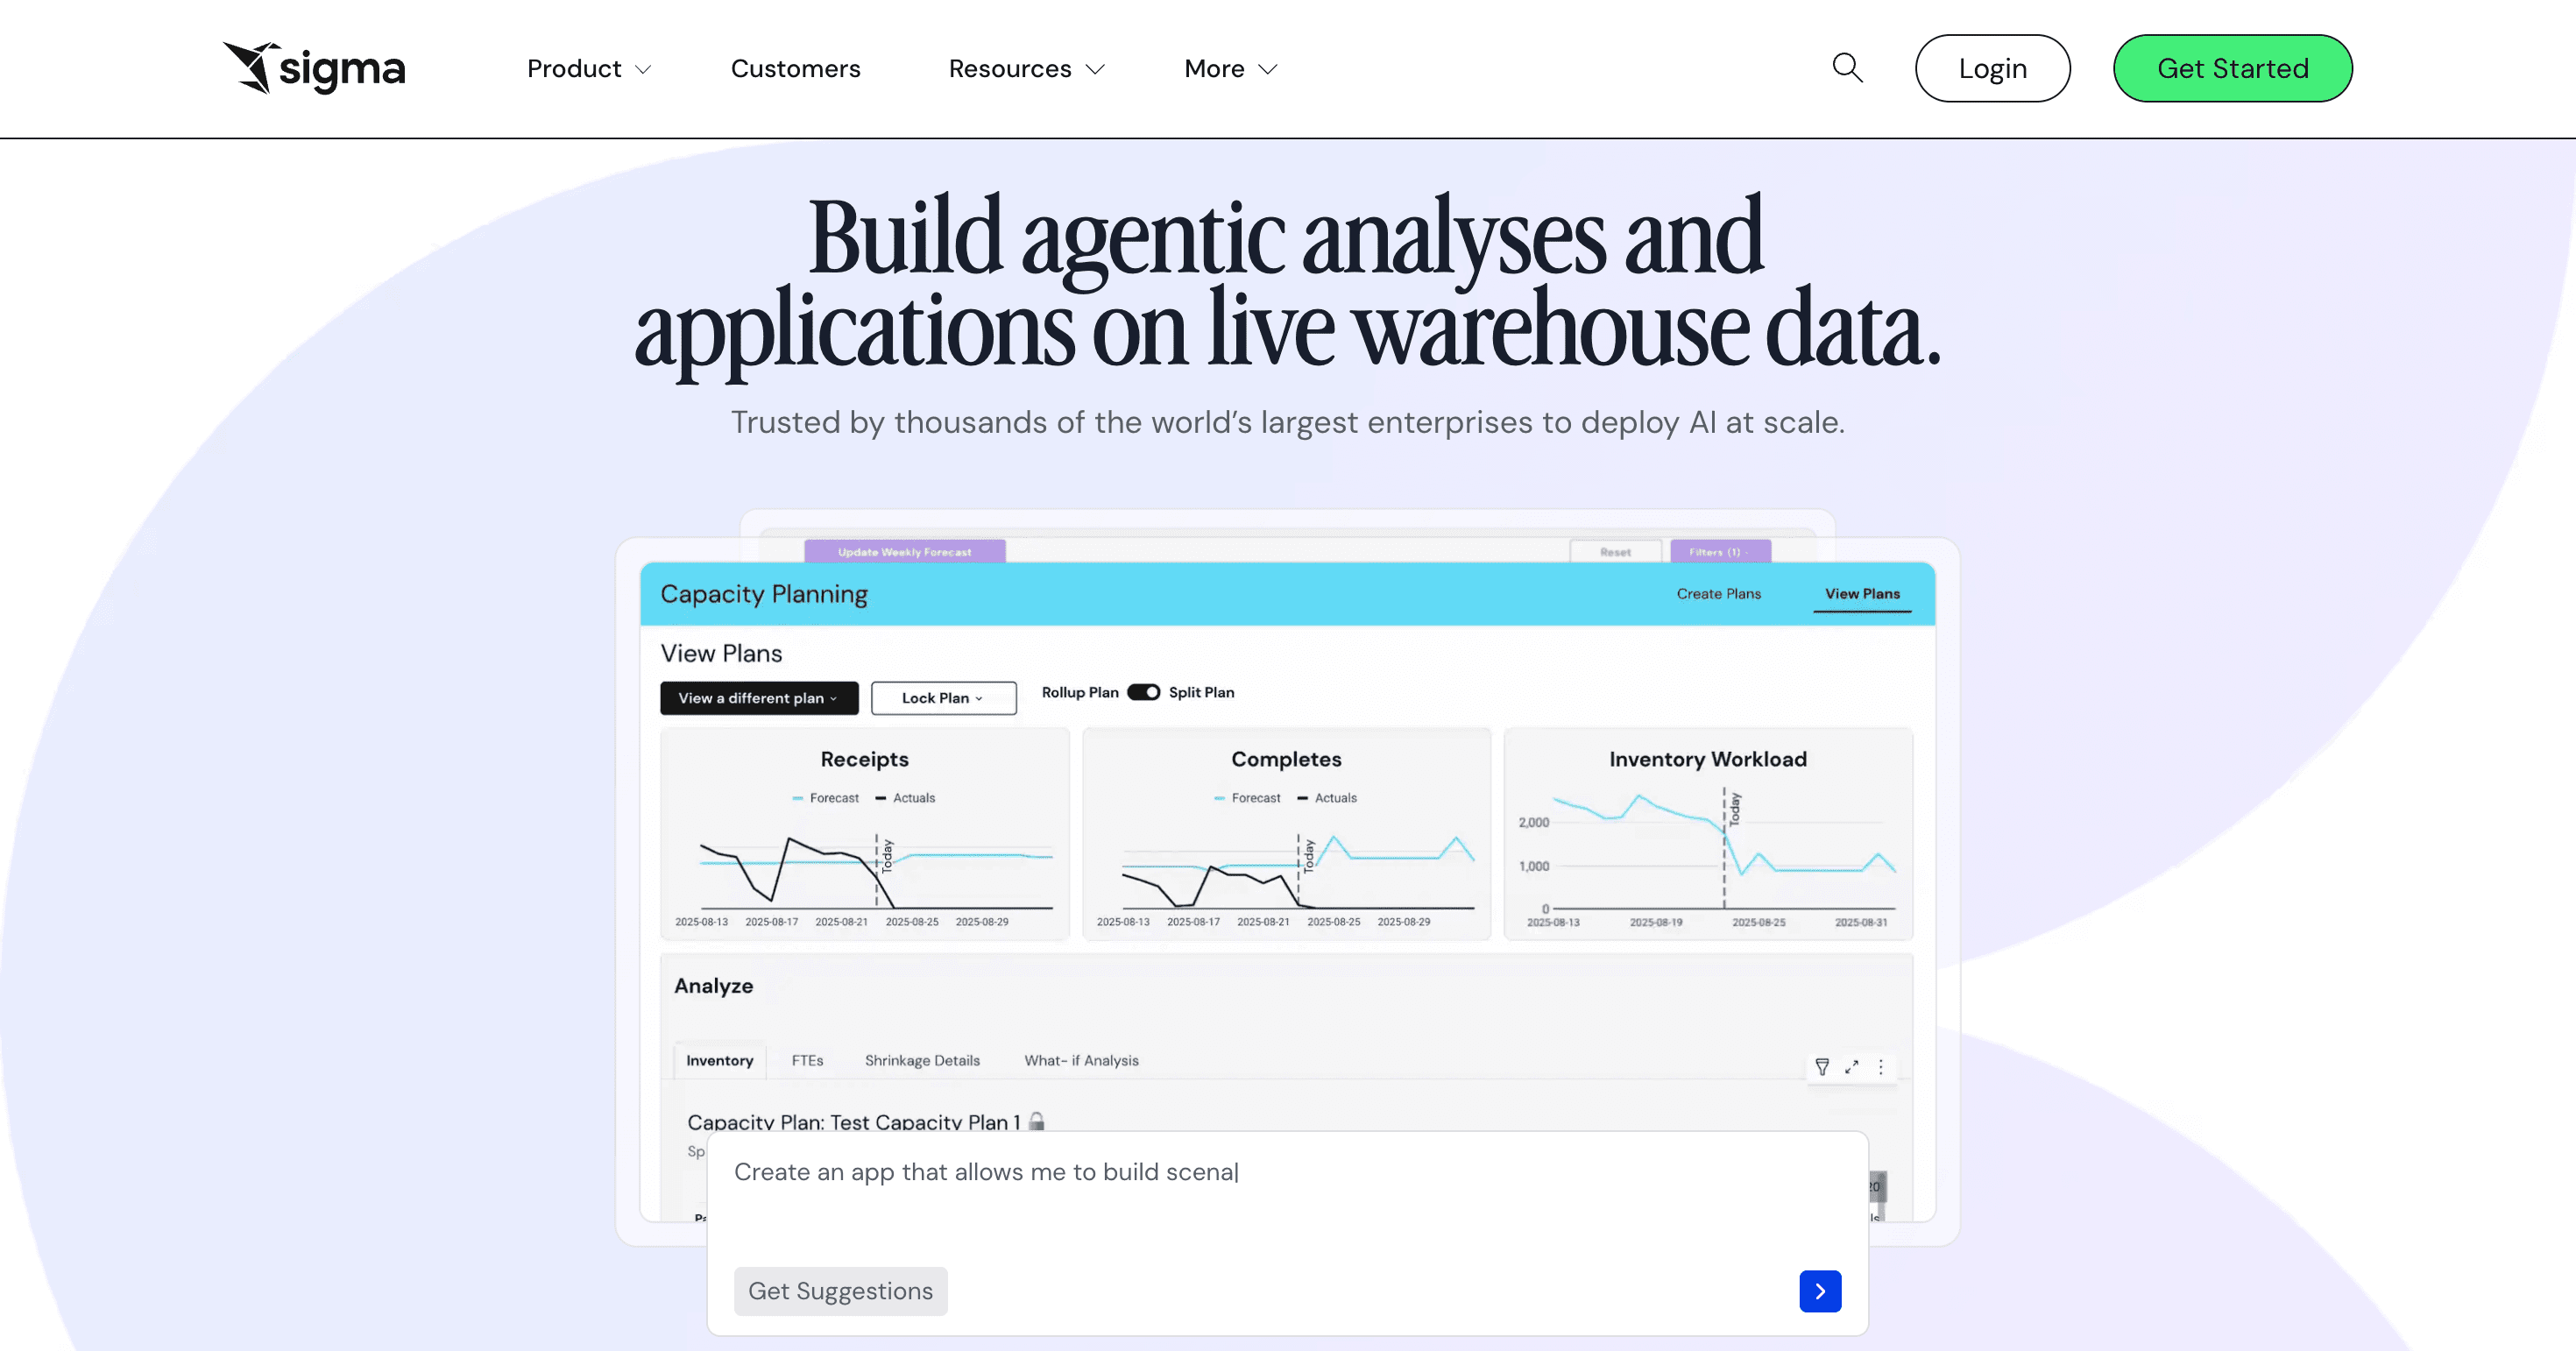
Sigma brings a spreadsheet interface directly to the cloud data warehouse, targeting users who want Excel-style flexibility without extracting data to local machines.
Dimension | Sigma Computing |
|---|---|
Analytical Depth | Functions primarily as a spreadsheet UI over warehouse data. Does not synthesize insights, reason across sources, or perform prescriptive analysis without user-driven construction. |
Data Source Connectivity | Pushes compute directly to Snowflake or BigQuery, which scales well but limits connectivity to warehouses rather than broader source diversity. |
Self-Service Accessibility | Accessible for users comfortable in spreadsheets. Users without that background still require analyst support to construct meaningful analyses. |
Governance and Data Trust | Relies on the underlying warehouse's security controls. No independent semantic layer or access-controlled execution paths within the platform itself. |
Operational Cost | User licenses are predictable. Heavy live queries increase cloud warehouse compute usage in ways that can compound unexpectedly at scale. |
6. Sisense
Sisense targets embedded analytics use cases, using proprietary caching to accelerate query response in customer-facing applications.
Dimension | Sisense |
|---|---|
Analytical Depth | Adequate for visual analytics embedded in external products. Not designed for internal enterprise deep-dive analysis or autonomous reasoning workflows. |
Data Source Connectivity | Connectivity is supported but tightly coupled to its proprietary ElastiCube architecture, which adds data movement overhead. |
Self-Service Accessibility | Built primarily for developer-led embedding rather than internal self-service by business users. |
Governance and Data Trust | Lacks enterprise-grade governance, audit trails, and dynamic access controls required for sensitive internal analytics at scale. |
Operational Cost | Node-based pricing is difficult to forecast. Does not align with optimized per-query token economics at enterprise volume. |
How to Choose
The platforms in this list overlap significantly on surface features. The real differences appear when you apply these five architectural criteria to how each platform actually executes queries, enforces governance, and handles questions that weren't pre-built.
Platform | Analytical Depth | Connectivity | Self-Service | Governance | Cost |
|---|---|---|---|---|---|
Genloop | ✓ | ✓ | ✓ | ✓ | ✓ |
Looker | ◐ | ✓ | ◐ | ✓ | ✕ |
Power BI | ◐ | ◐ | ◐ | ◐ | ◐ |
Qlik Sense | ◐ | ◐ | ◐ | ◐ | ◐ |
Sigma Computing | ◐ | ◐ | ◐ | ◐ | ◐ |
Sisense | ◐ | ◐ | ✕ | ✕ | ✕ |
If your primary need is governed reporting within a Microsoft environment, Power BI is the path of least resistance. If semantic consistency is the priority and cost is secondary, Looker's LookML architecture is a defensible choice. If the goal is for business users to get answers to questions that weren't pre-modeled, without adding to the analyst queue, only Genloop addresses that at the architectural level rather than as a feature layer.
FAQs
Do I need to migrate data to use Genloop? No. Genloop queries your live data sources directly. It connects to Snowflake, BigQuery, Redshift, PostgreSQL, MySQL, and SQL Server without requiring data movement into a proprietary layer. Book a demo to see it working against your own stack.
What makes an enterprise BI tool actually enterprise-grade? Concurrent query handling, row-level security that travels with the data rather than living in custom SQL views, governance audit trails, semantic consistency across teams, and query performance that holds under real concurrency loads. Most demos skip all five. Genloop's governance architecture is built around these constraints.
How does Genloop prevent hallucinated answers? Every query is validated against the Unified Business Memory layer before a result is returned. Genloop scores confidence on each query and withholds low-confidence answers, prompting users for clarification rather than returning something wrong.
Can Power BI's natural language features replace a purpose-built conversational analytics platform? No. Power BI's Q&A and Copilot features sit on top of a traditional dashboard architecture. They improve with synonyms and semantic model investment, but complex or unusual business phrasing still requires manual DAX adjustment. Purpose-built conversational platforms make natural language the execution layer, not an add-on.
What is agentic BI and why does it matter for enterprise data teams? Agentic BI means the platform can run multi-step analysis and surface insights without a human constructing each query path. For enterprise data teams, it shifts BI from a reporting layer into a system that can answer questions proactively. Genloop's reasoning agents are built on this model.
What should enterprises evaluate before replacing Tableau? Concurrency limits under real workloads, semantic layer flexibility, governance depth, time-to-insight for non-technical users, and total cost of ownership across user tiers including compute overhead. Evaluate these against your actual query volume and not a vendor's demo dataset.