
Until now, Genloop worked one way: you asked the right question, and it delivered the answer with trust, at the best cost. That model has a limit, and it's not the platform. It's that someone still has to ask. The right question, at the right time, every time.
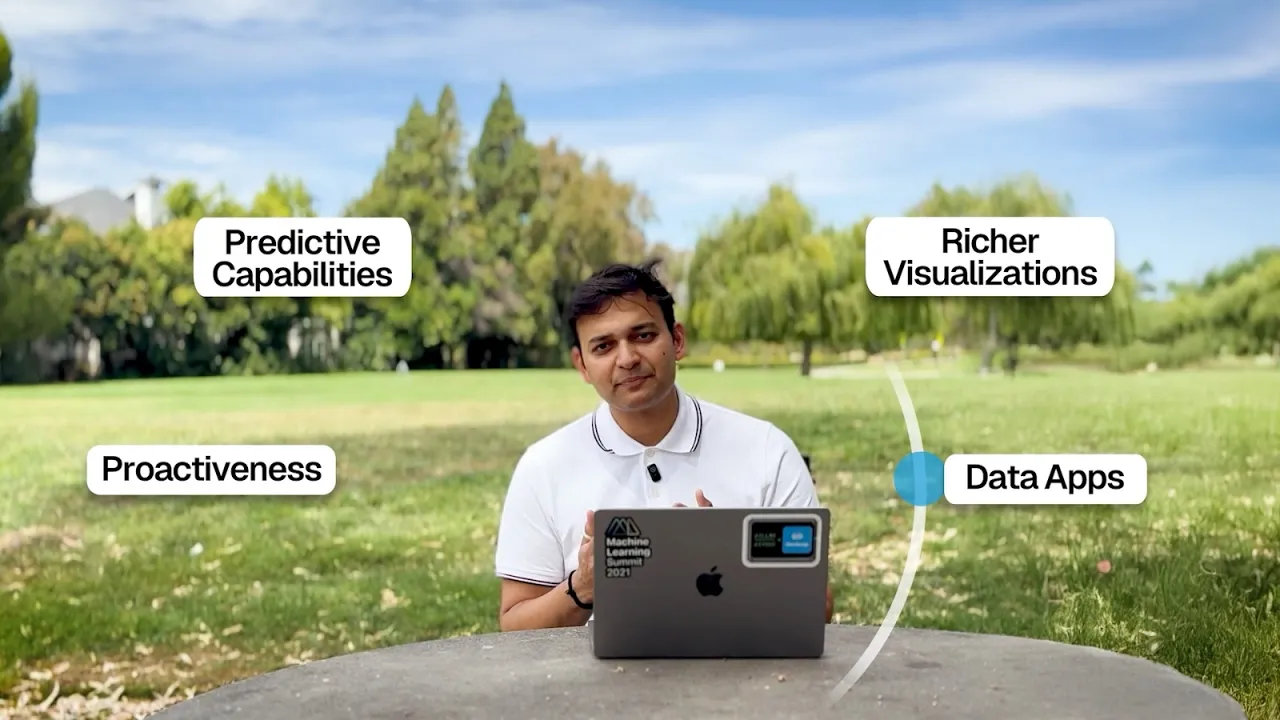
This release removes that limit. Four updates, all pointed at the same goal: moving Genloop from answering questions to solving business outcomes.
What's new
Automations put any insight on a time or event trigger, with deep investigation that finds root causes before you've asked.
Predictive modeling is live: ask about next quarter, not just last quarter, directly in chat.
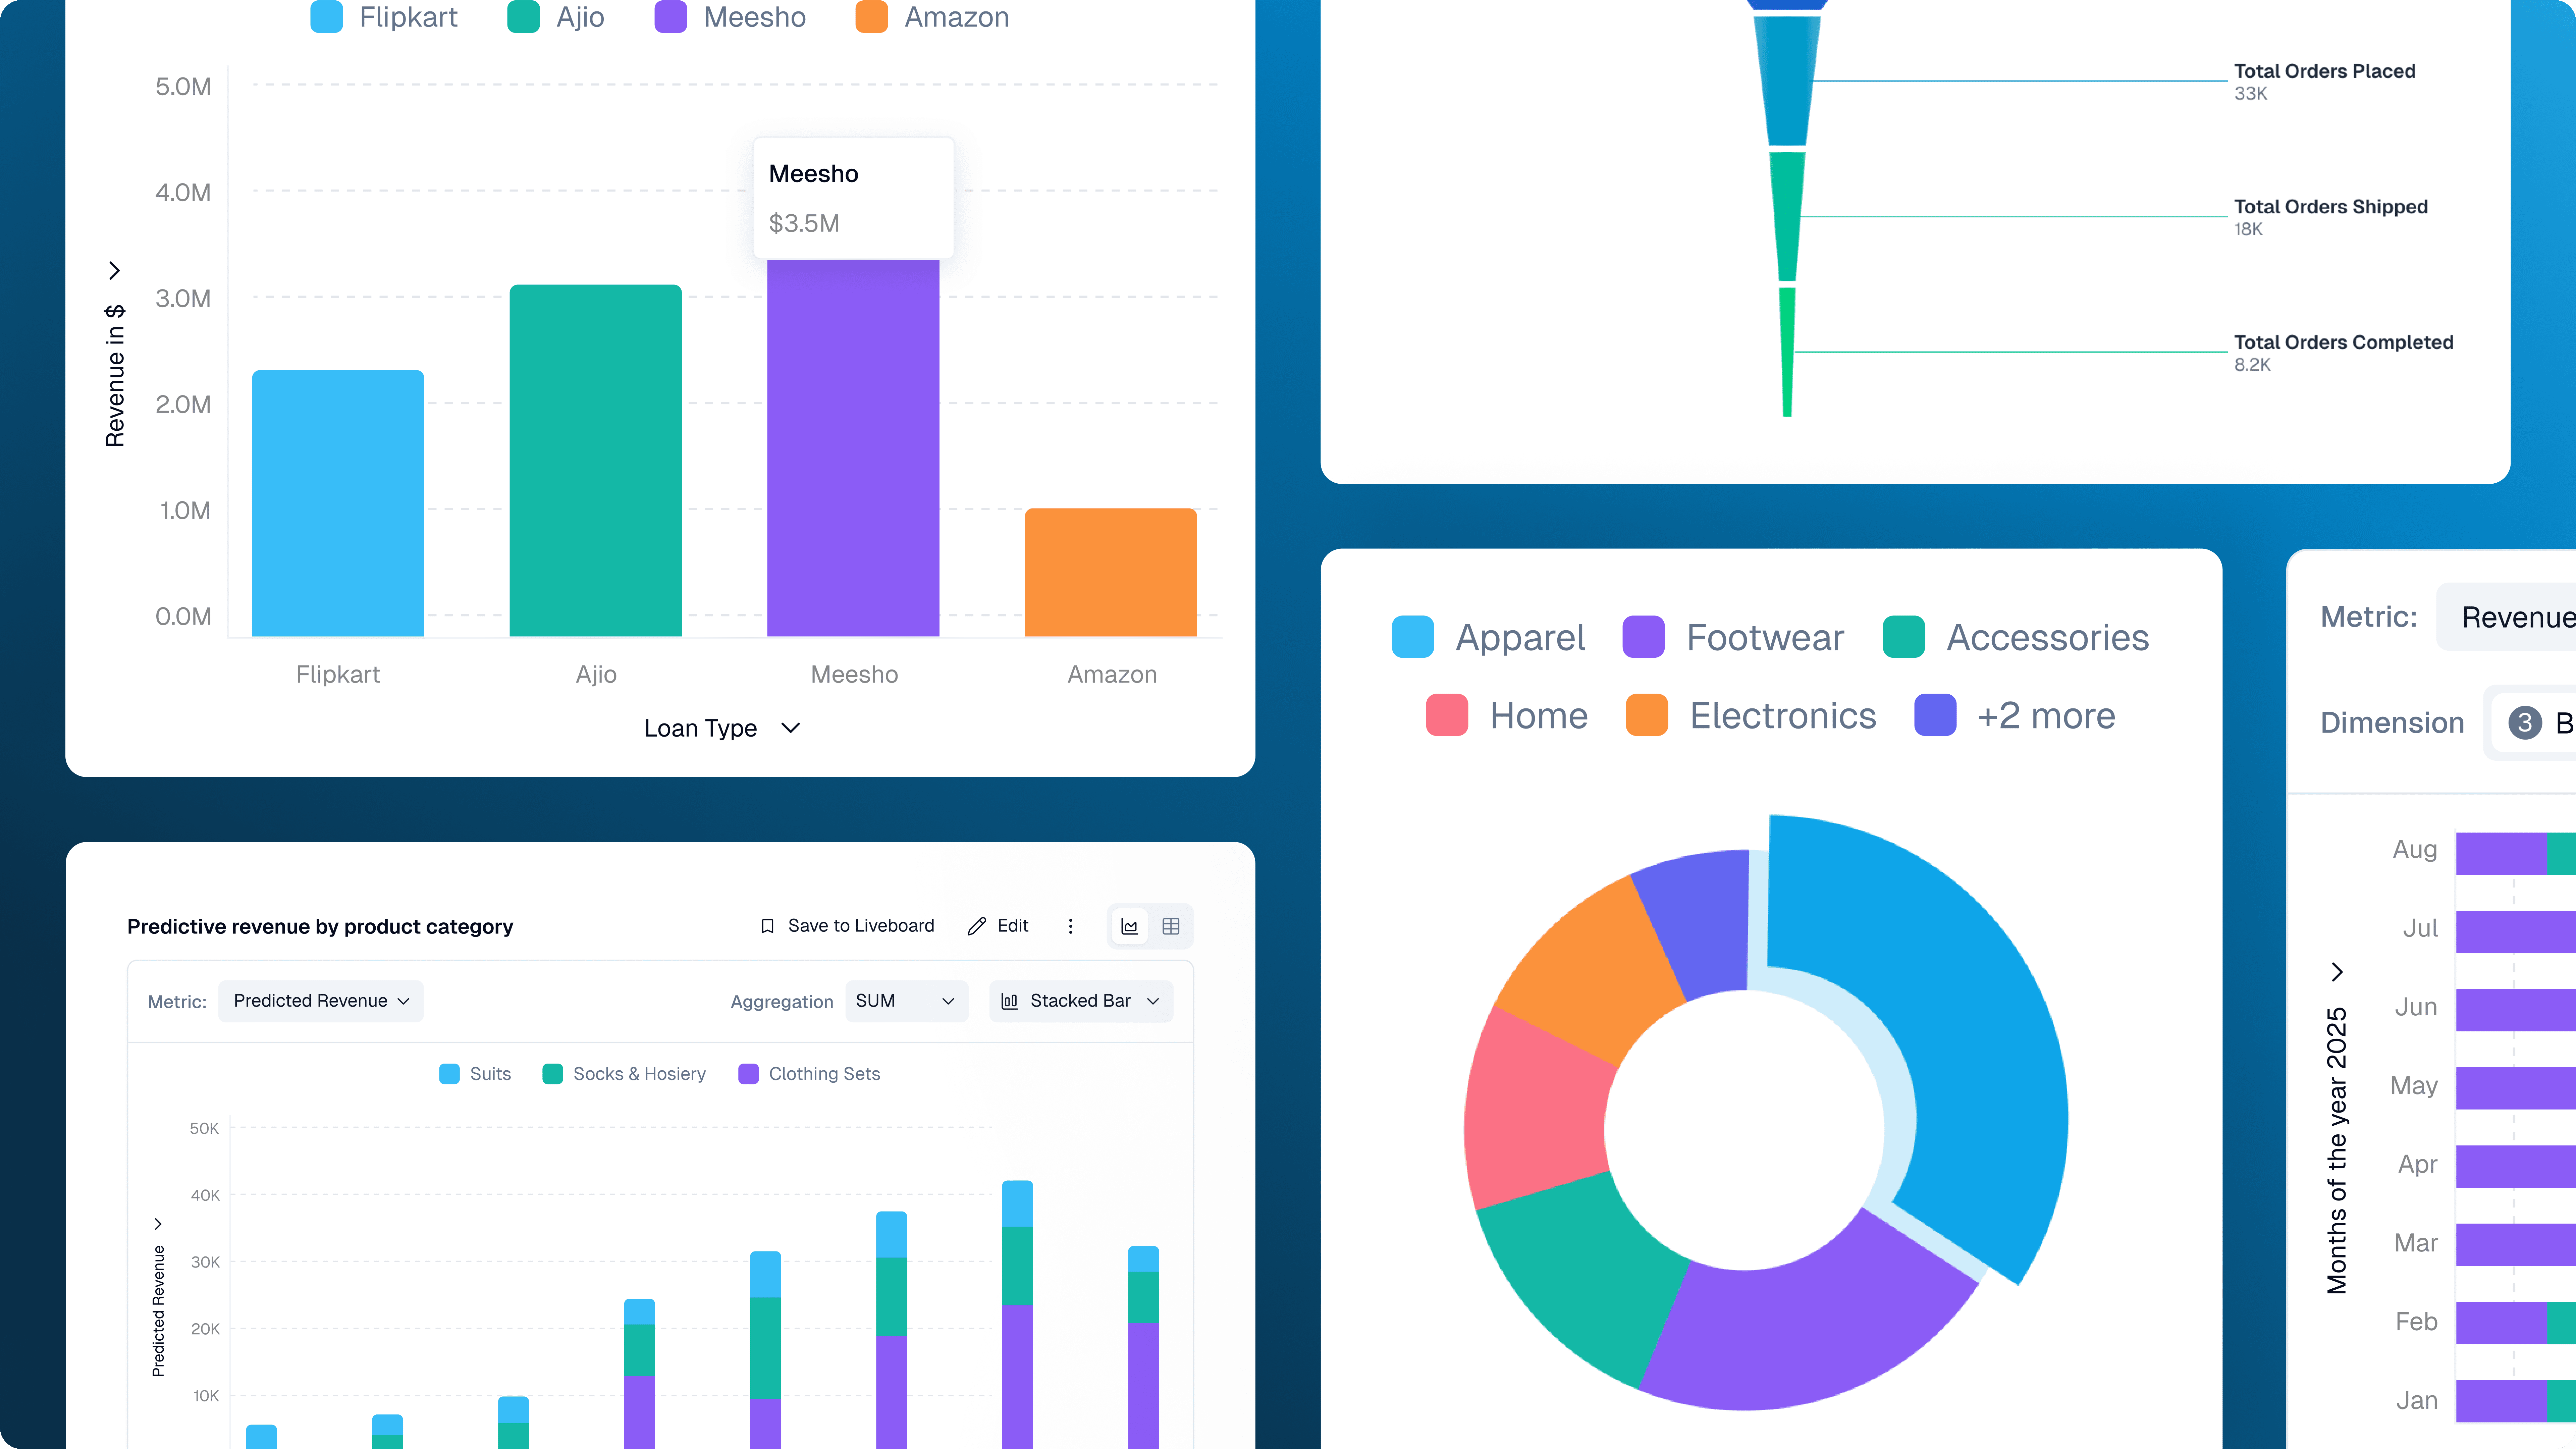
Richer visualizations: funnels, heat maps, stacked columns, area charts, and more, with multiple charts woven into a single answer.
Data Apps: build reports, presentations, and automations directly on top of your data, with interactive charts, ready to share with your team.
Automations: insights that come to you
The oldest problem in analytics is timing. The data knew your metric was slipping on Tuesday. You found out in Friday's review. Nothing was broken except the part where a human had to think to check.
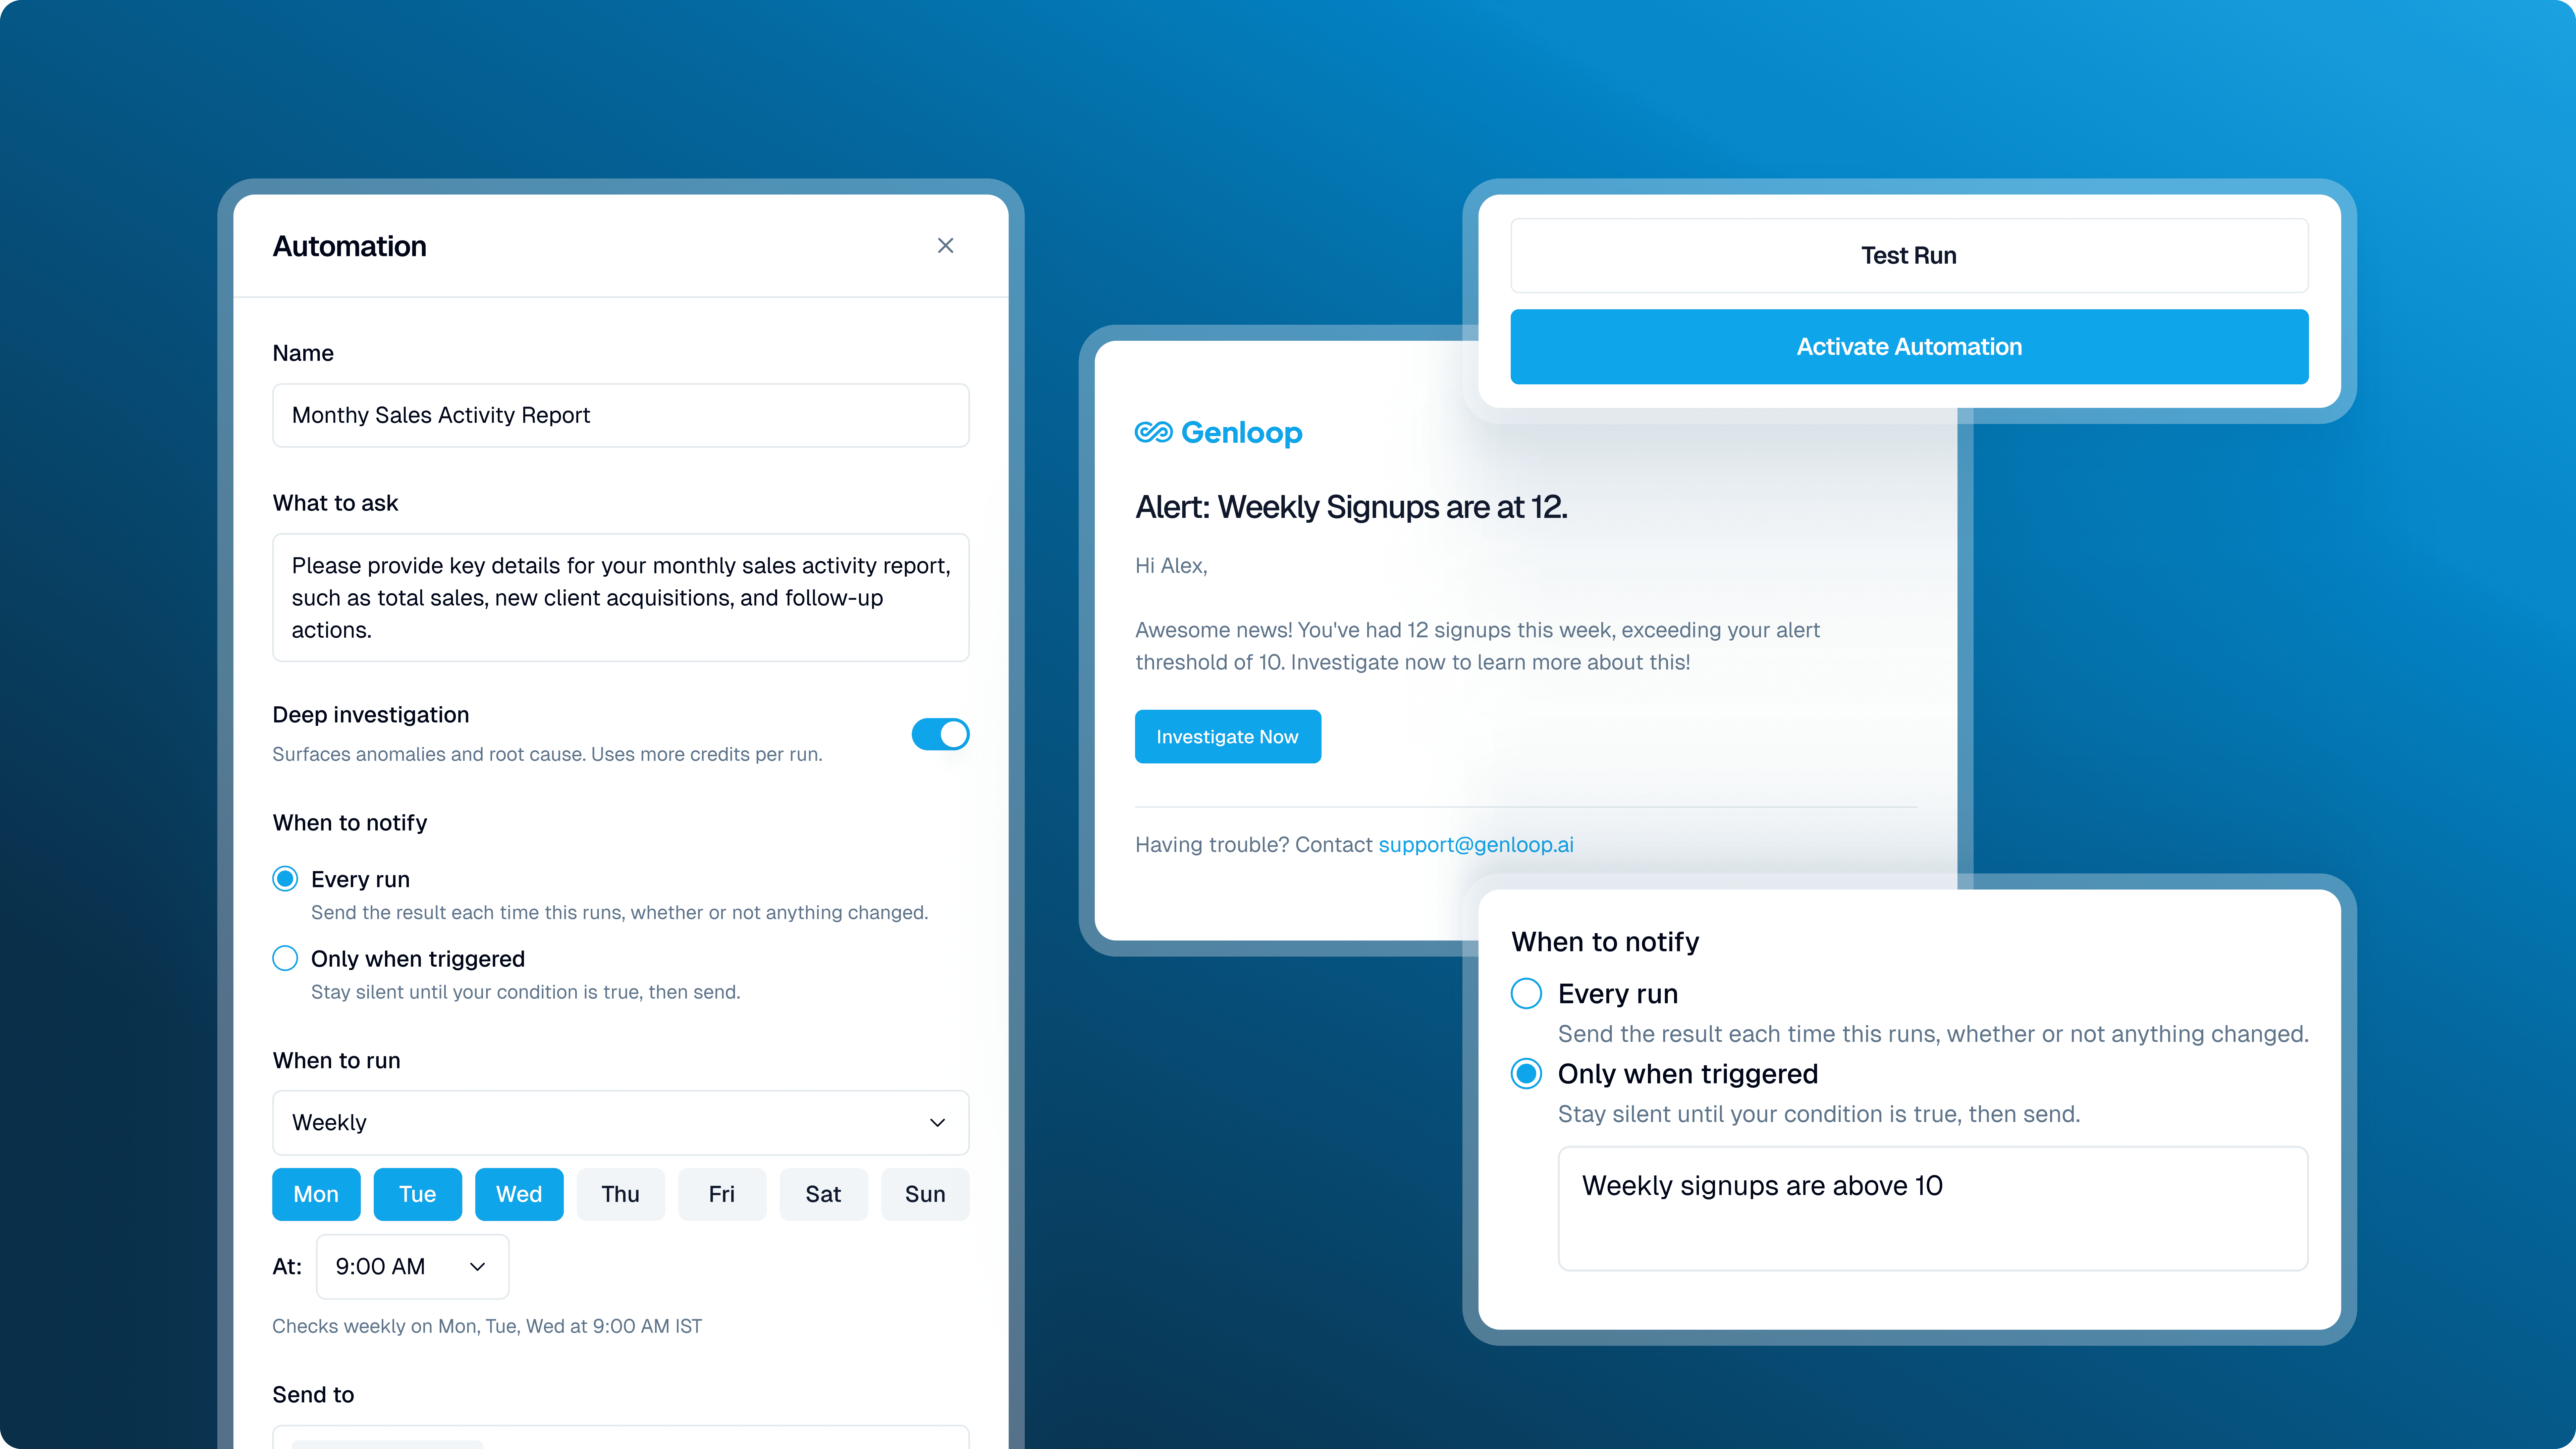
Automations close that gap. You can now put any insight or action on a cadence: a time trigger for your weekly numbers, or an event trigger tied to a condition on your metrics. Genloop watches continuously and stays silent until something matters. No digest noise, no daily emails you stop reading by week two.
When a condition does fire, Genloop doesn't stop at the alert. With deep investigation enabled, it runs the root cause analysis on its own: what moved, which segment drove it, when it started. The result reaches you where your team already works, in email, Slack, or Teams. The full breakdown of triggers, schedules, and delivery is on the reports and automation page.
Predictive modeling: ask about next quarter
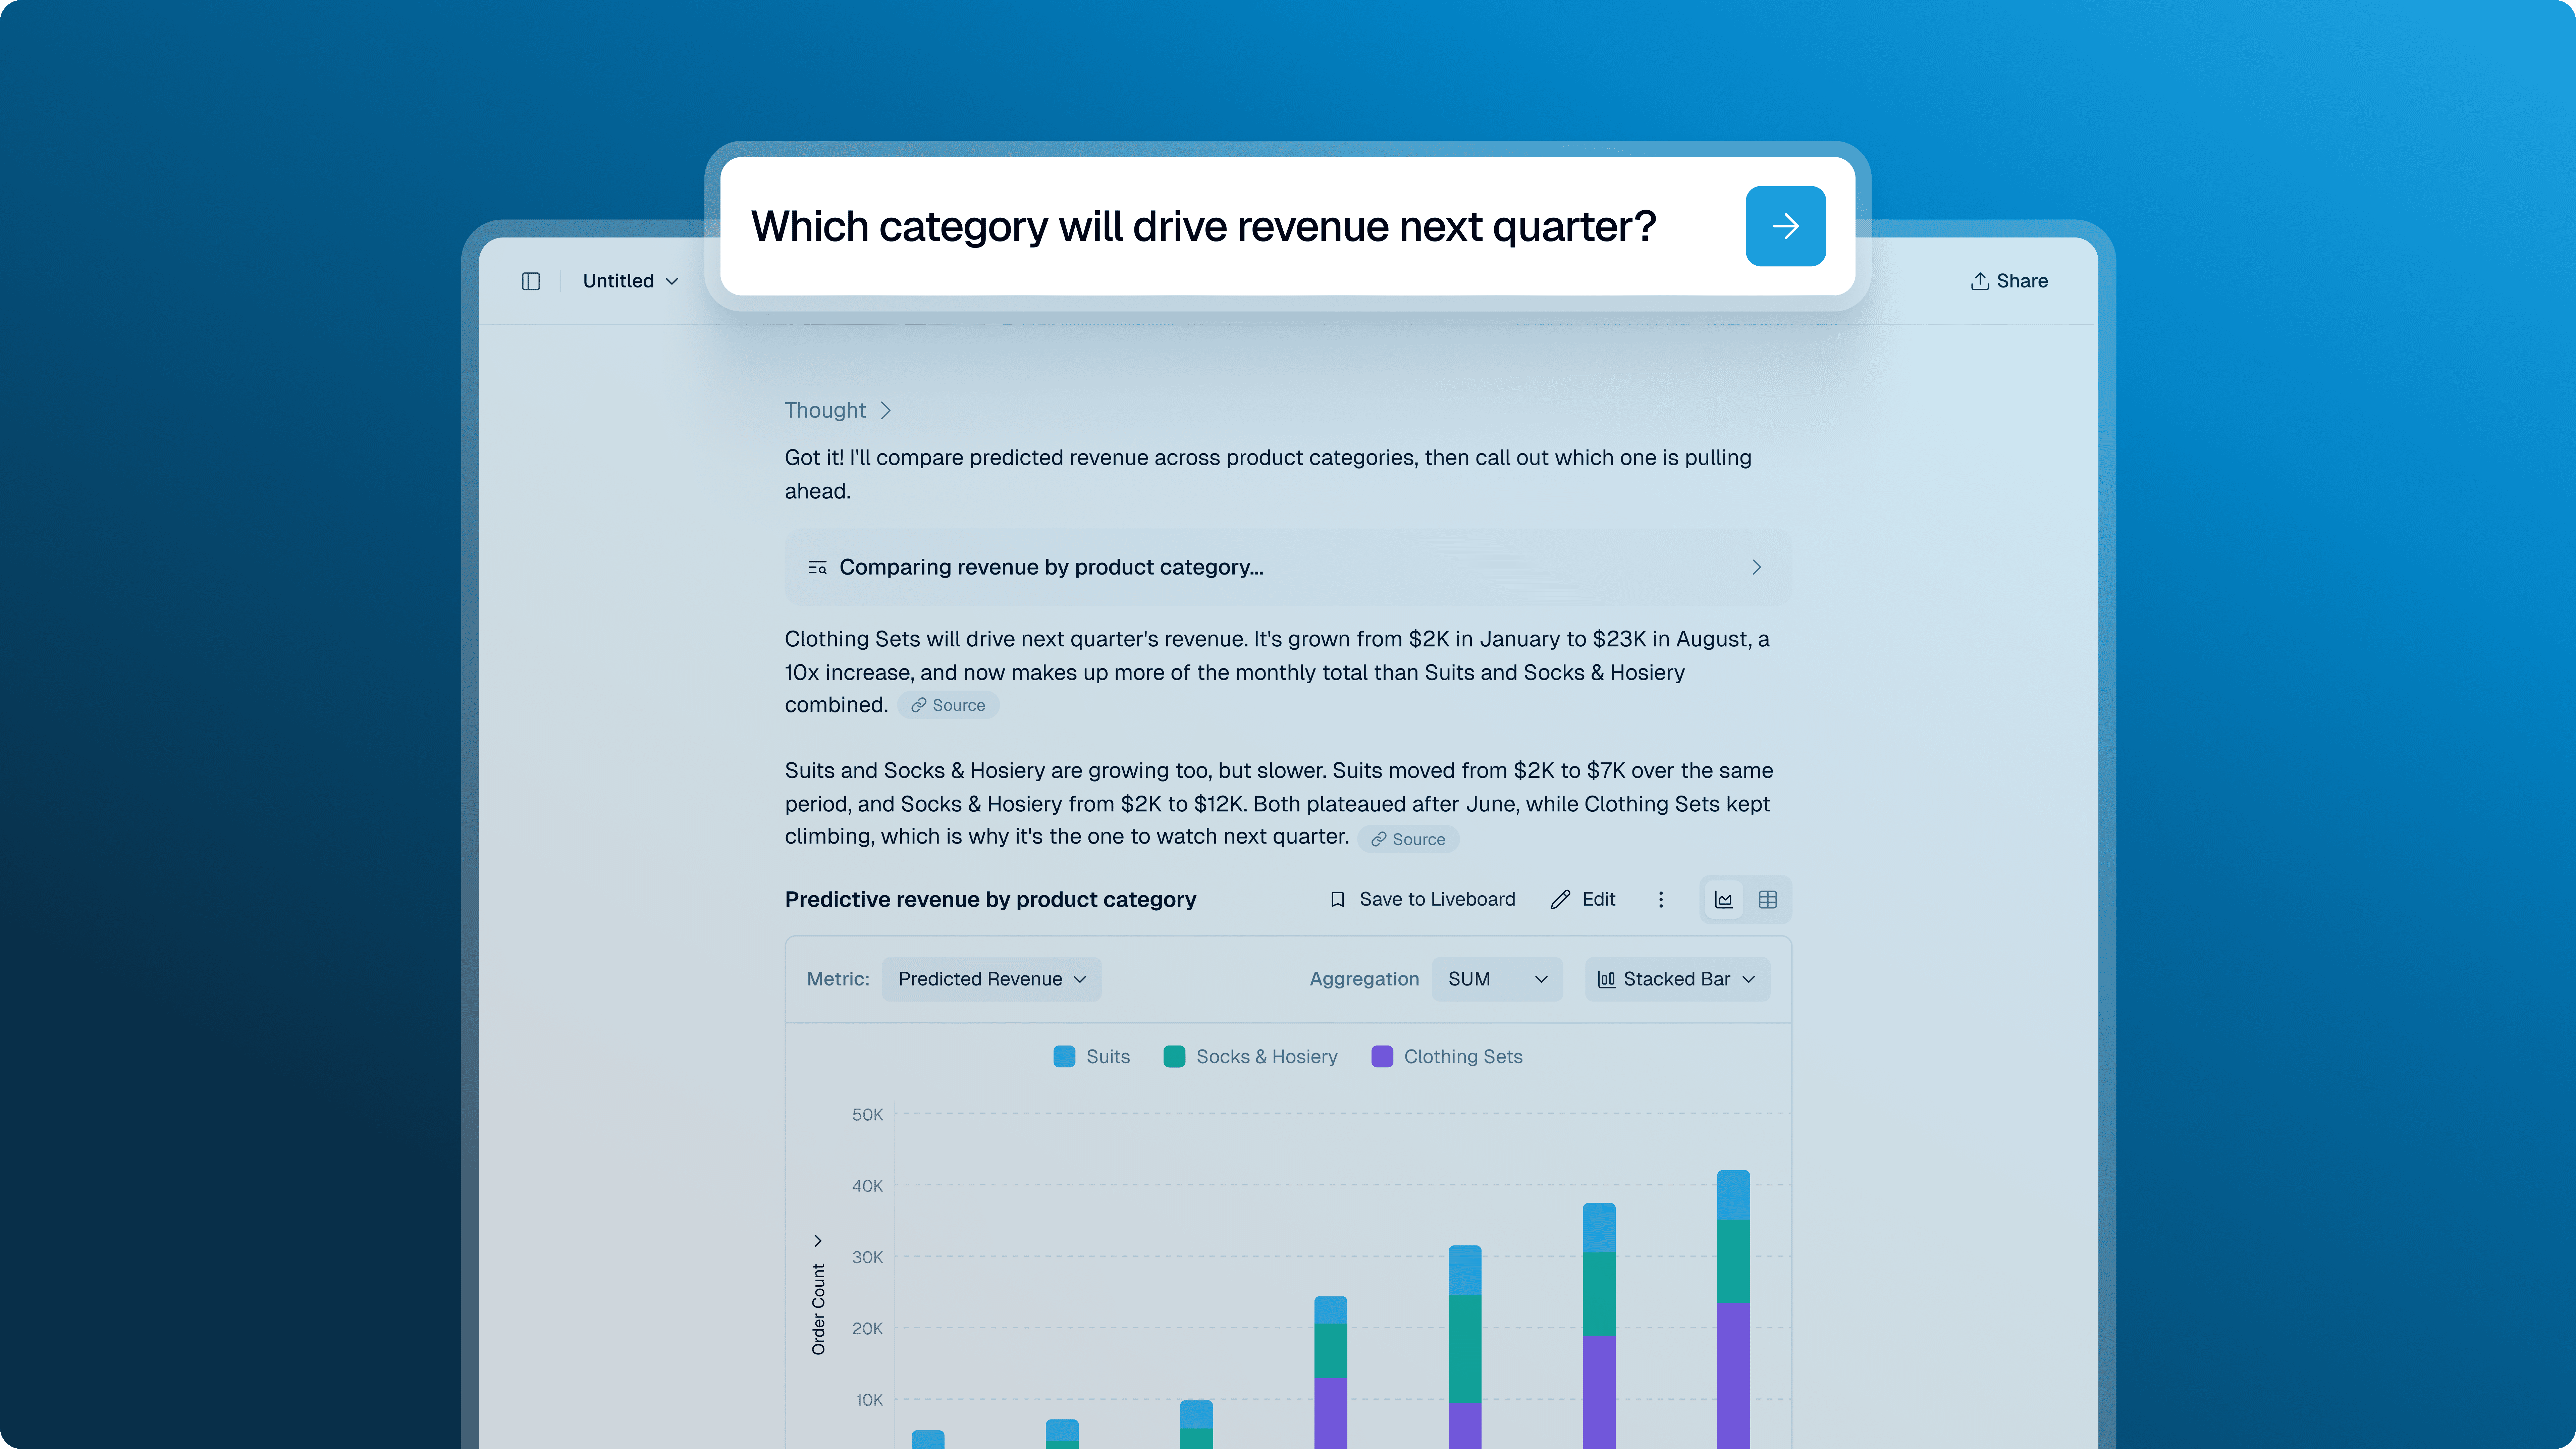
This one came straight from user requests. A large share of real questions were never about the past. Which category will drive revenue next quarter. Which customers are likely to churn. How much inventory to stock before the festive season.
Those questions are now answerable in chat. Ask, and Genloop builds predictive models on your data and returns the projection the same way it returns any other answer in chat: with the reasoning visible, on your governed data, no separate ML workflow or handoff to a data science queue.
Richer visualizations that tell the complete story
Our visualization support was limited, and we knew it. This release rebuilds it.
Genloop now answers with the chart that fits the question: funnels, heat maps, stacked columns, area charts, and more. If you'd rather see it another way, switch chart types directly on the answer, adjust axes and breakdowns, and save the view to your Liveboard.
The bigger change is for bigger questions. When one chart can't carry the answer, Genloop weaves multiple charts into a single response, so a question like "how did revenue move across channels and categories this quarter" comes back as one composed answer instead of four follow-ups.
Data Apps: reports and presentations built on your data
The last mile of analytics has always been manual. The analysis exists, and then someone spends Thursday evening packaging it into a deck.
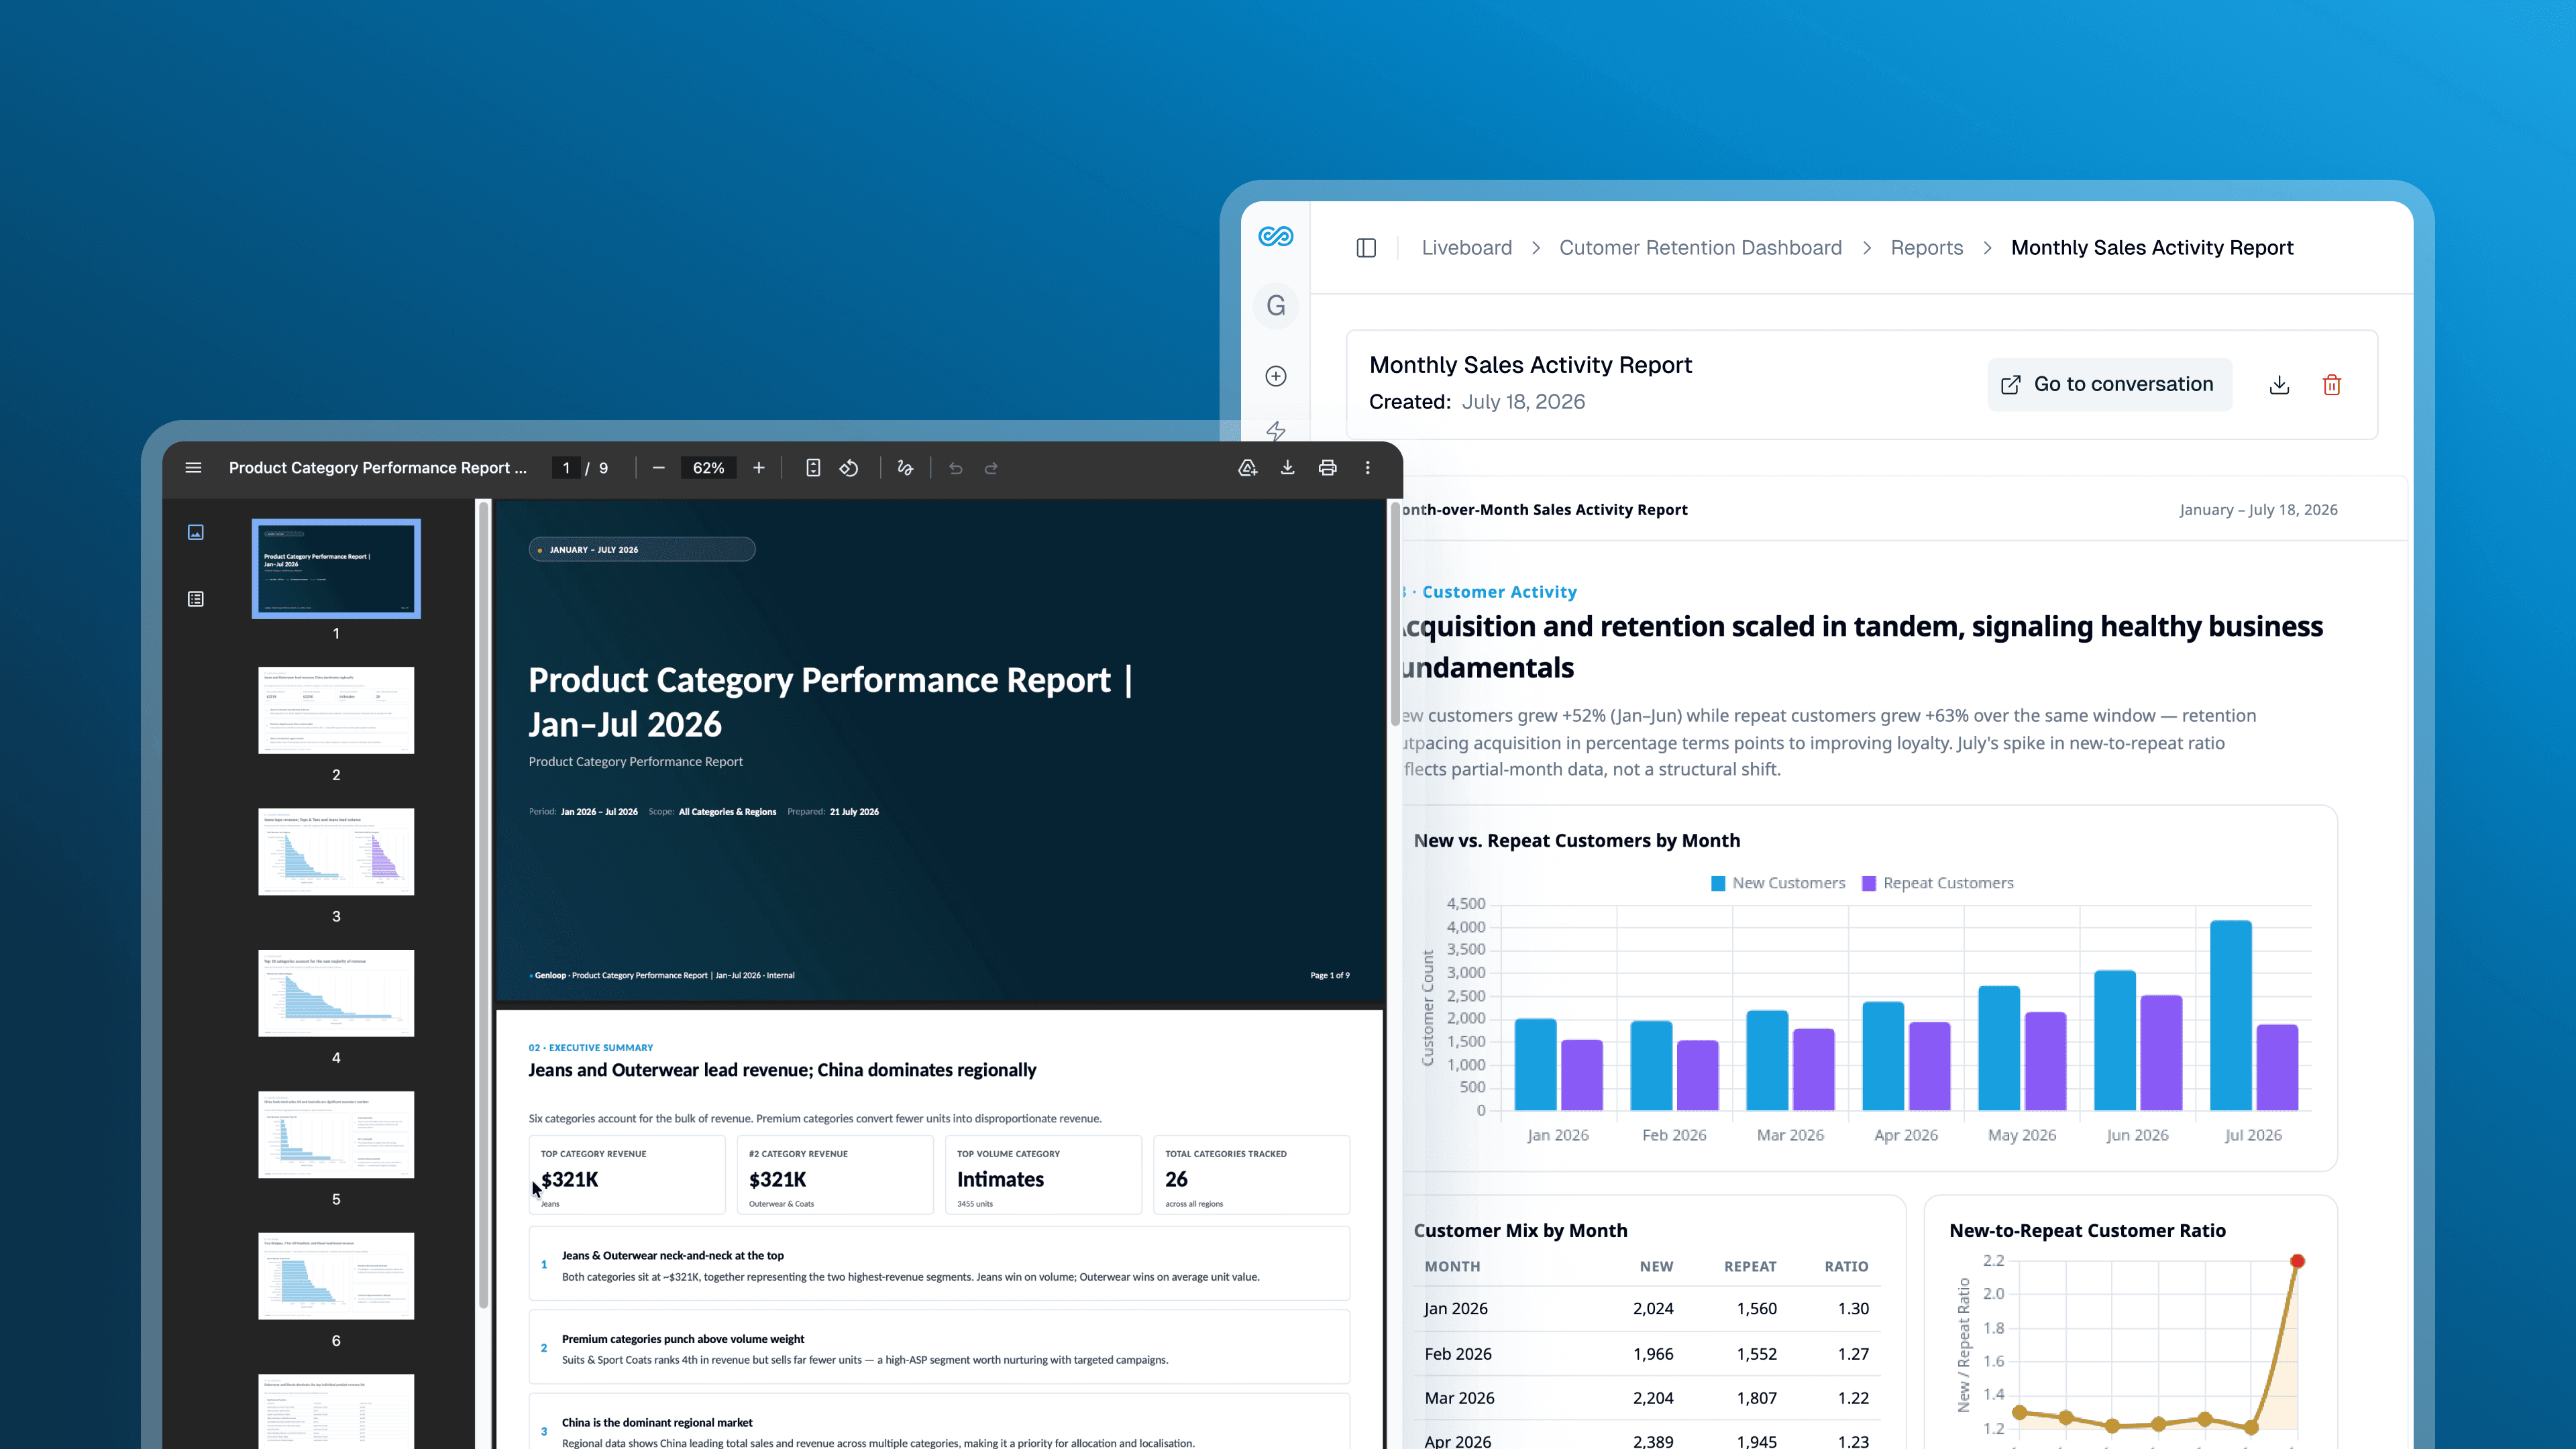
Data Apps change that. You can now build reports and presentations directly from chat or your Liveboard, and put them on automations so they arrive on schedule. Your weekly business review, your QBR, your customer success deck: say the word, and Genloop compiles it from live data with key insights, anomalies in the latest trend, and what needs attention first. The charts inside are interactive, not static screenshots, so whoever you share it with can explore the numbers, not just read them. When it's ready, share it with your team directly.
Because Data Apps are built on the same governed layer as everything else in Genloop, the numbers in the deck match the numbers in the warehouse. No copy-paste drift between the dashboard and the boardroom.
Live today
All four updates are live at app.genloop.ai for every workspace, no migration needed. Existing Liveboards and saved insights work with automations and reports out of the box.
The shift underneath this release is simple. Analytics tools have always assumed the human does the watching and the machine does the counting. That assumption is what we removed. If you want to see what that looks like on your enterprise data, schedule a demo.