
Retail business intelligence (BI) tools consolidate sales, inventory, labor, and customer data into dashboards and reports that leaders use to run stores. Most retailers already own a BI license, since Power BI is near-ubiquitous, yet much of the data never gets used. Forrester estimates that 60% to 73% of enterprise data goes unused for analytics. So the useful 2026 question is not which tool builds the prettiest dashboard, but which one gets a trustworthy, governed answer to the people who actually run each store. On delivering that governed, conversational answer with strong agentic capabilities and visualisations to a store manager who will never open a modeling canvas, Genloop is the standout here.
Key Takeaways
Classic BI tools (Power BI, Tableau, Qlik, Looker) are dashboard-and-visualisation layers that assume an analyst to model data and build reports.
For conversational, governed answers without an analyst, Genloop queries live retail data in place (no copies) and pushes recipient-specific briefs to each operator.
Power BI wins on Microsoft-native cost, Tableau on visualisation, Qlik on associative exploration. No single tool wins every dimension.
Retail-specific BI (Phocas) ships pre-built models, shortcutting the modeling work general BI requires.
What Is Retail Business Intelligence?
Retail business intelligence is the practice and tooling for collecting retail data, including POS, inventory, labor, and customer records, and turning it into dashboards, reports, and answers that inform merchandising, operations, and finance decisions. A retail BI tool connects to those sources, applies a governed semantic model, and presents metrics through visualisations or natural-language queries. The phrase covers two distinct things buyers often blur: the dashboard-and-visualisation layer classic tools provide, which assumes an analyst models the data and builds reports, and the delivery layer that gets a correct number to a store manager who will never open a modeling canvas. Most failures trace back to buying the first when the need was the second.
What Problems Does Retail BI Solve?
How Do Leaders See Every Store in One View?
BI consolidates fragmented POS and store data into a single governed view, so a district or regional leader compares locations on consistent metrics. Without it, each store reports in its own spreadsheet shape, and a regional manager spends the week reconciling formats instead of acting on the gaps. The value is not the chart. It is the agreement that every location counts a sale, a void, and a labor hour the same way, so a ranked store list actually means something. A consolidated view also makes outliers obvious.
The one store with collapsing conversion or creeping shrink stops hiding inside a healthy chain average, which is exactly where the recoverable margin sits. It is the difference between managing by anecdote and managing by evidence.
Why Do Numbers Disagree Between Reports?
A governed living context graph is a single, central definition of each metric that every report draws from, so "comp sales" or "conversion" means the same thing everywhere. It ends the "my number versus your number" arguments that quietly fragment retail decisions. When finance, merchandising, and store ops each compute a metric their own way, meetings turn into reconciliation sessions and trust erodes. Fixing one definition per metric, enforced by the tool rather than by convention, lets a leadership team argue about the decision instead of the number. This is where most retail BI rollouts succeed or fail. A tool can connect to every source and still produce conflicting answers if definitions live in individual reports rather than one shared layer.
Can Store Managers Self-Serve Without IT?
Search-first and conversational BI let non-analysts answer their own questions, cutting the reporting backlog on a small data team. A manager who can ask "why did margin drop in store 12 last week" gets an answer in seconds, not days.
How We Evaluated These Tools
We assessed each tool against the criteria that decide a retail BI rollout, ordered by what matters most to operators rather than analysts: retail use-case fit first, then self-service and natural-language access, governance (role-based, per store), integrations with retail data sources, answer accuracy and trust, and pricing transparency. We do not publish a single composite score; instead each tool is matched below to the job it actually wins.
The 7 Best Retail Business Intelligence Tools in 2026
1. Genloop: Conversational, Accurate Retail Answers with Strong Visualisation
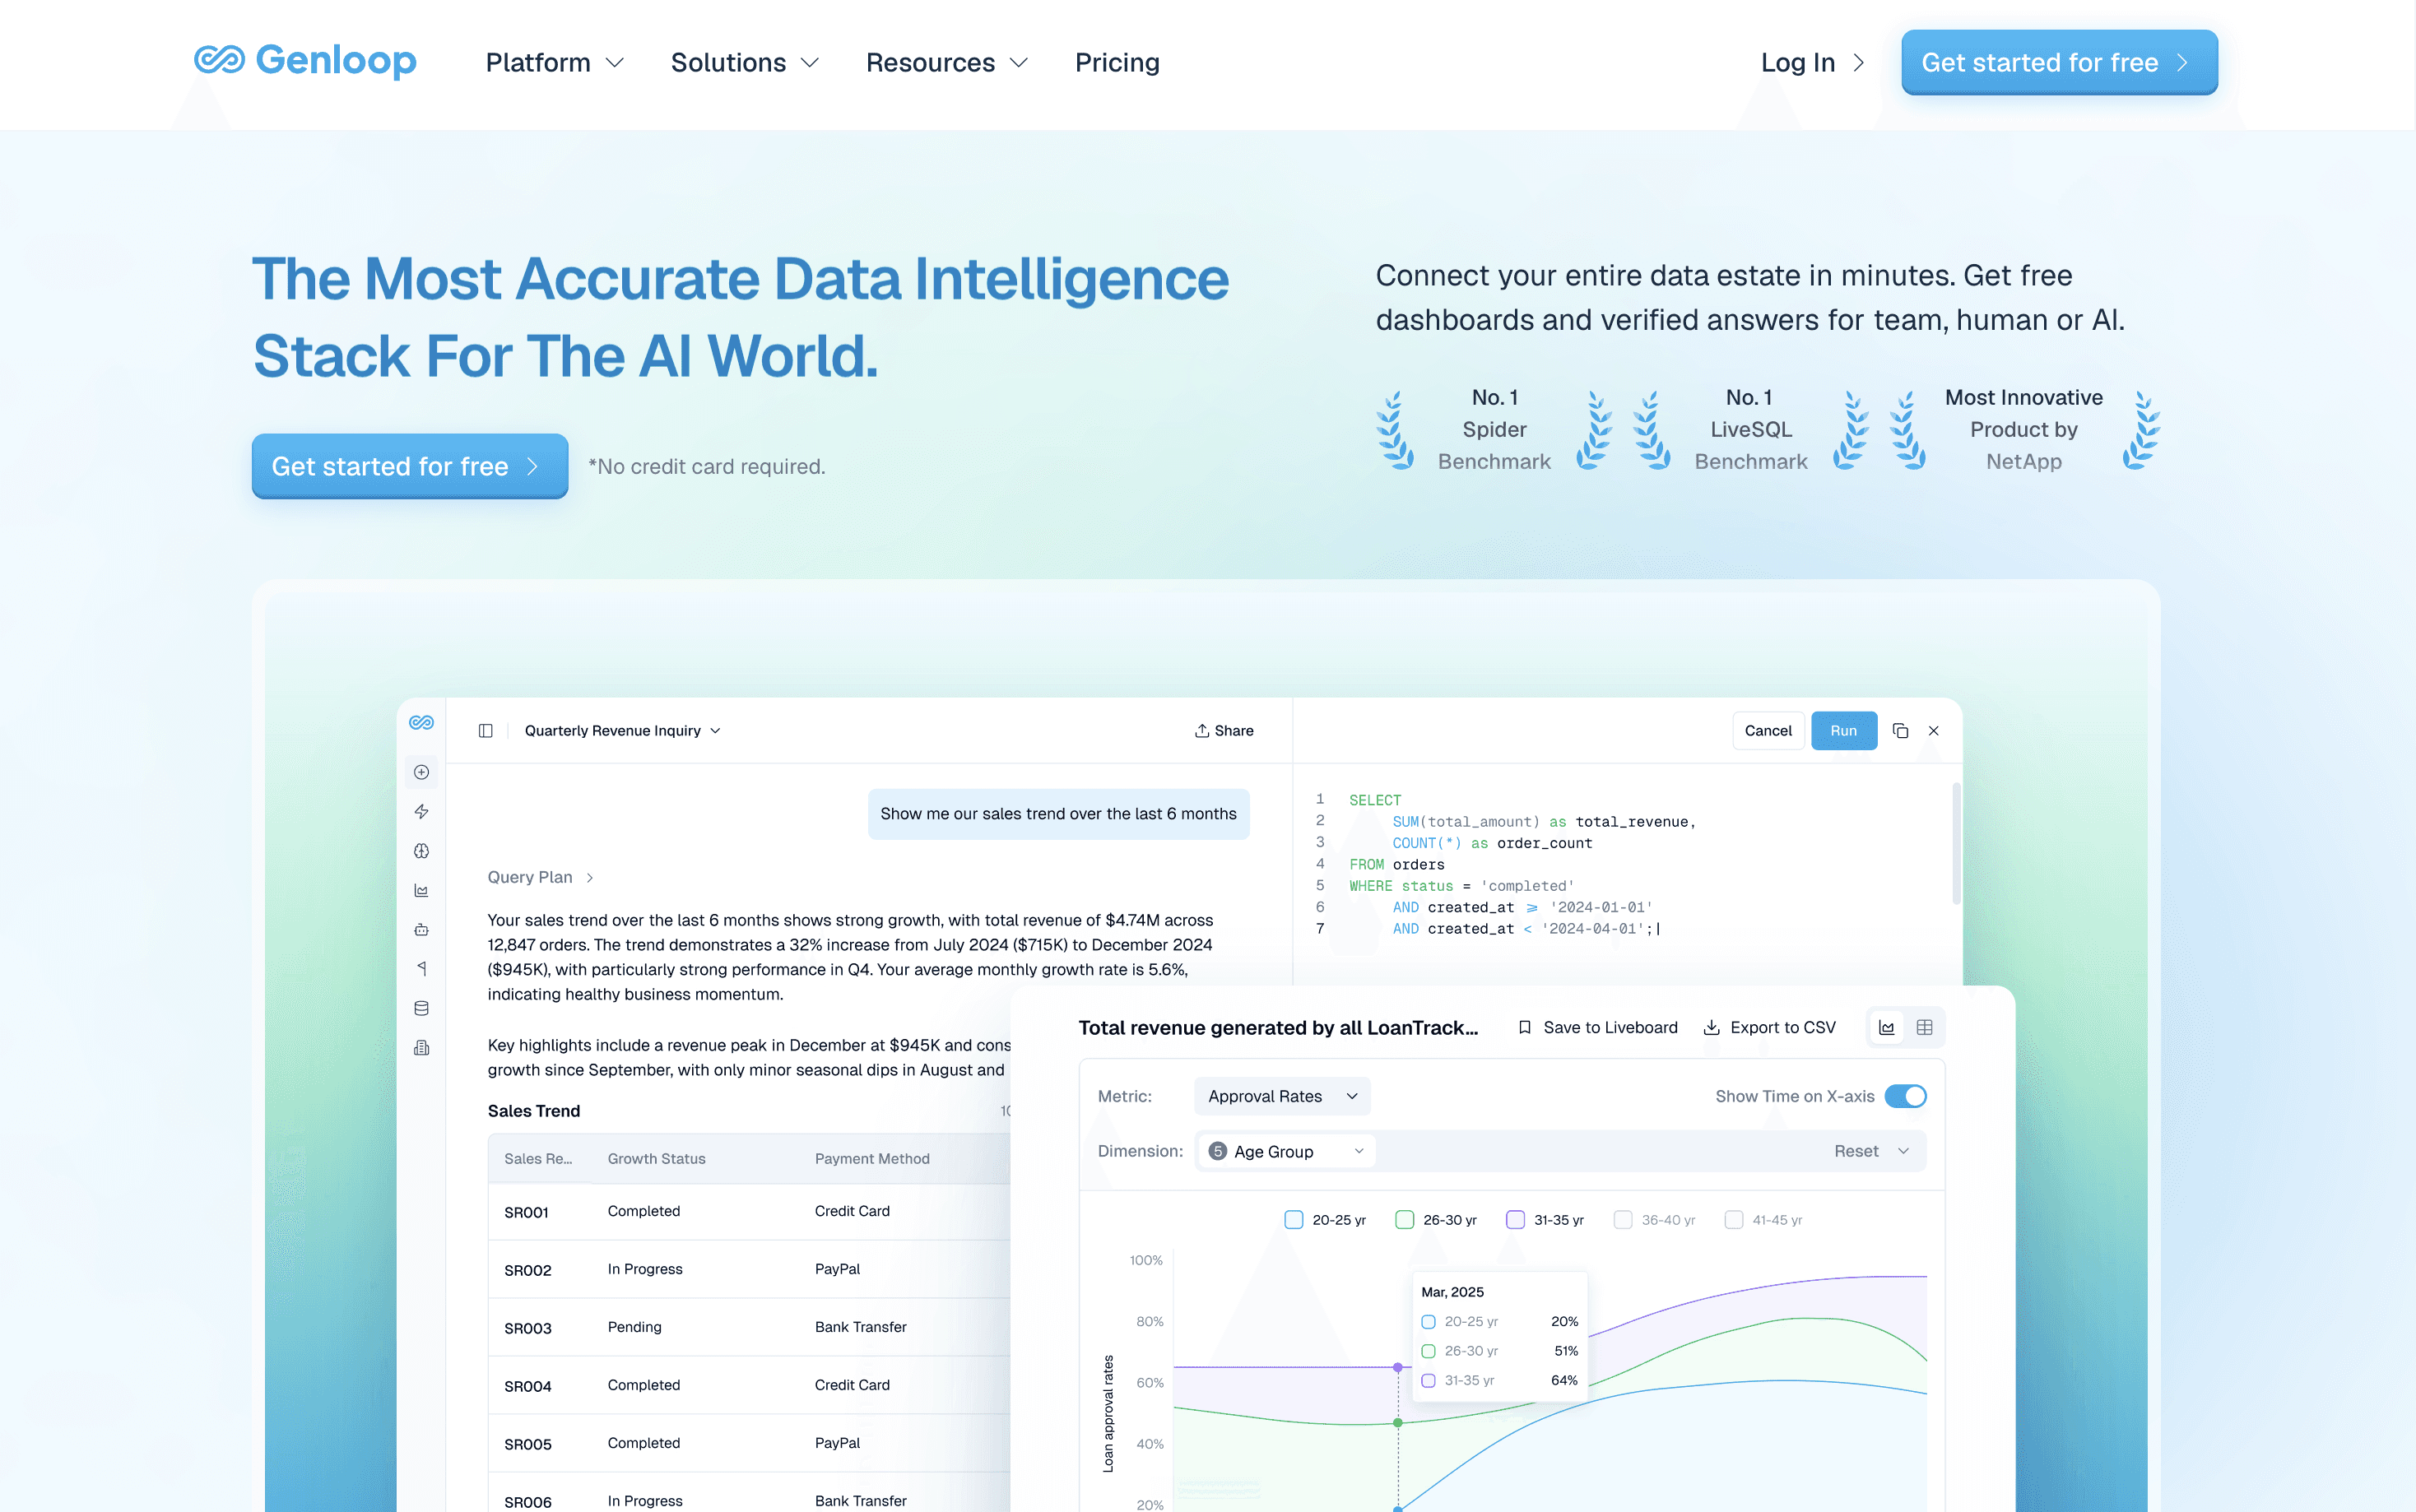
What it does: An intelligence layer over your retail data estate that answers questions in natural language and queries live data in place (no ETL), delivering governed, recipient-specific briefs on a schedule.
Who it's for: Multi-location operators who want answers, not dashboards, and lack a BI team.
Key feature: A Living Context Graph that keeps metric definitions stable across weeks and recipients.
Pricing: Free tier (no credit card), no per-seat charges; enterprise on request.
Not a fit if: You want a pixel-level dashboard designer or single source table connector.
2. Microsoft Power BI: Microsoft-Native Cost

What it does: Microsoft's BI platform, integrated with Excel, Azure, and Microsoft 365.
Who it's for: Microsoft-centric retailers wanting capable BI at a low price.
Key feature: Native Microsoft identity, security, and Office integration.
Pricing (mid-2026): Pro ~$14/user/mo; Premium capacity for larger deployments.
Not a fit if: Your estate is not Microsoft-centric, or non-analysts need conversational answers.
3. Tableau: Visualisation Craft
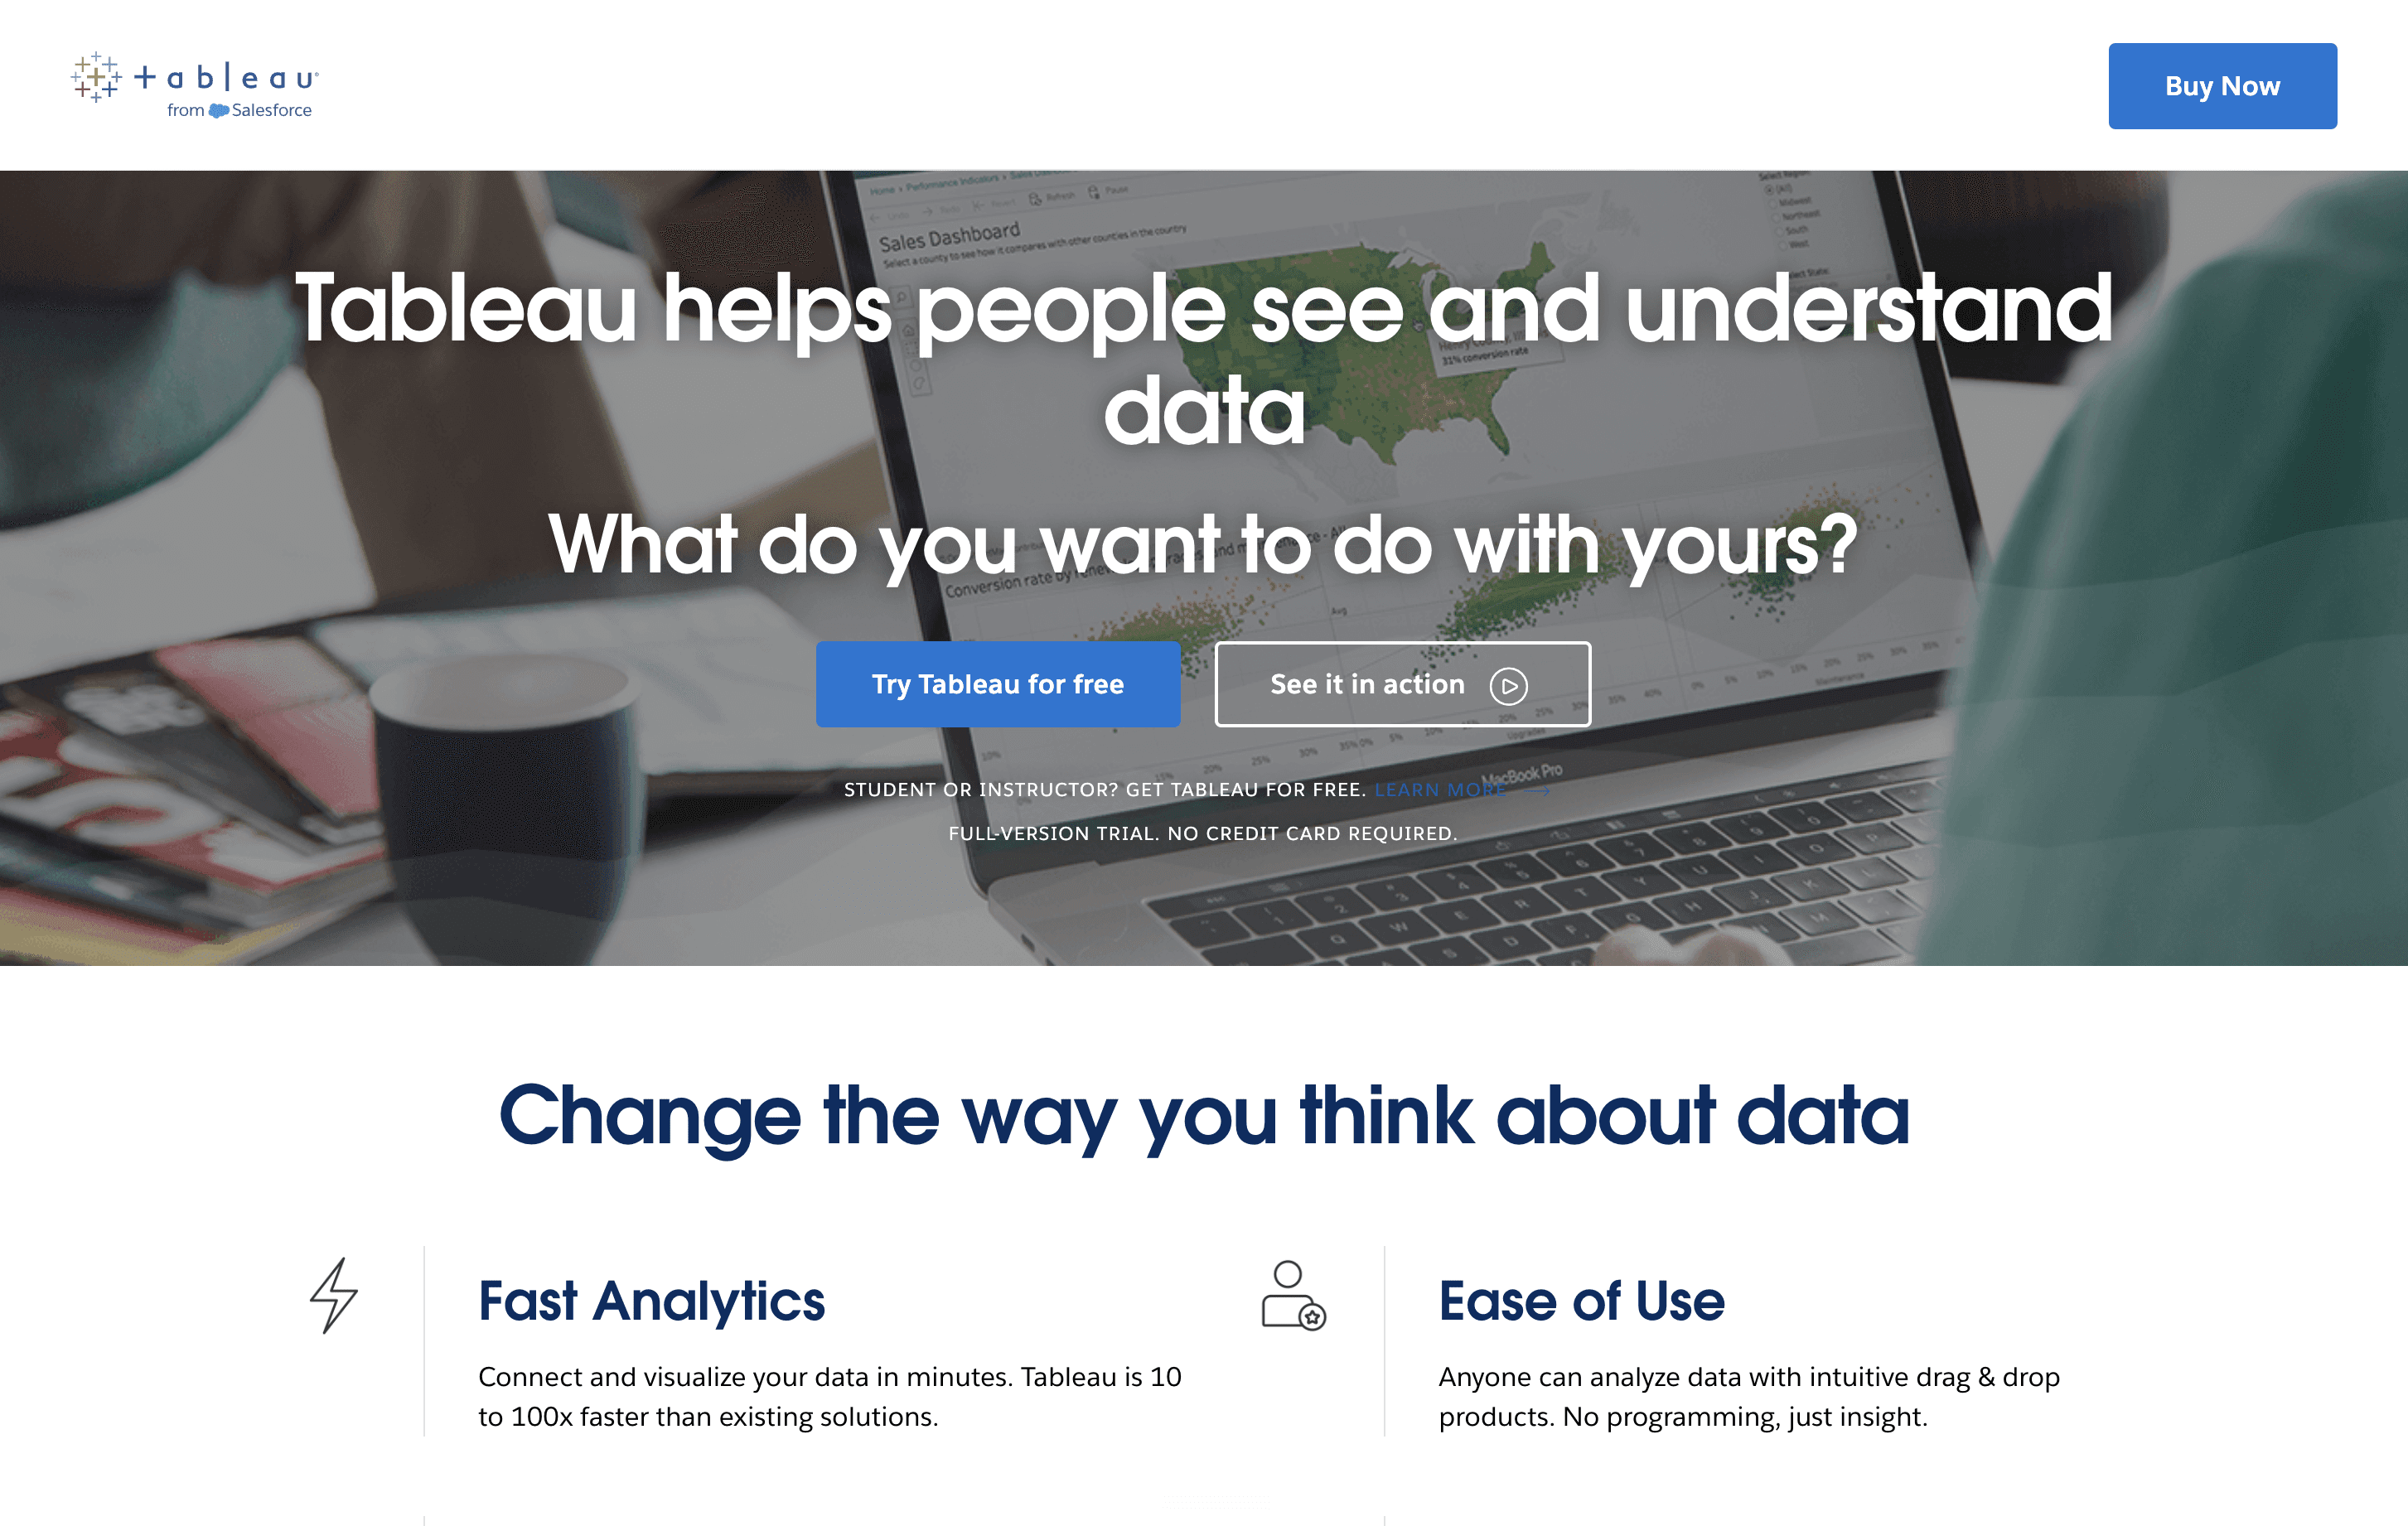
What it does: A visualisation-first BI platform for rich, interactive dashboards.
Who it's for: Retailers with a BI or analyst team wanting best-in-class dashboards.
Key feature: Deep, flexible visualisation and calculation.
Pricing (mid-2026): Creator ~$75/user/mo; Explorer and Viewer below.
Not a fit if: You have no analyst, or need pushed briefs rather than self-built ones.
4. Qlik: Associative Data Exploration

What it does: A BI platform whose associative engine explores relationships across data, not just predefined drill paths.
Who it's for: Retailers whose analysts do exploratory, hypothesis-driven analysis.
Key feature: An in-memory associative engine.
Pricing (mid-2026): Subscription tiers; confirm on vendor page.
Not a fit if: You want a turnkey conversational layer for non-technical operators.
5. Looker: Governed Metrics and Embedded BI
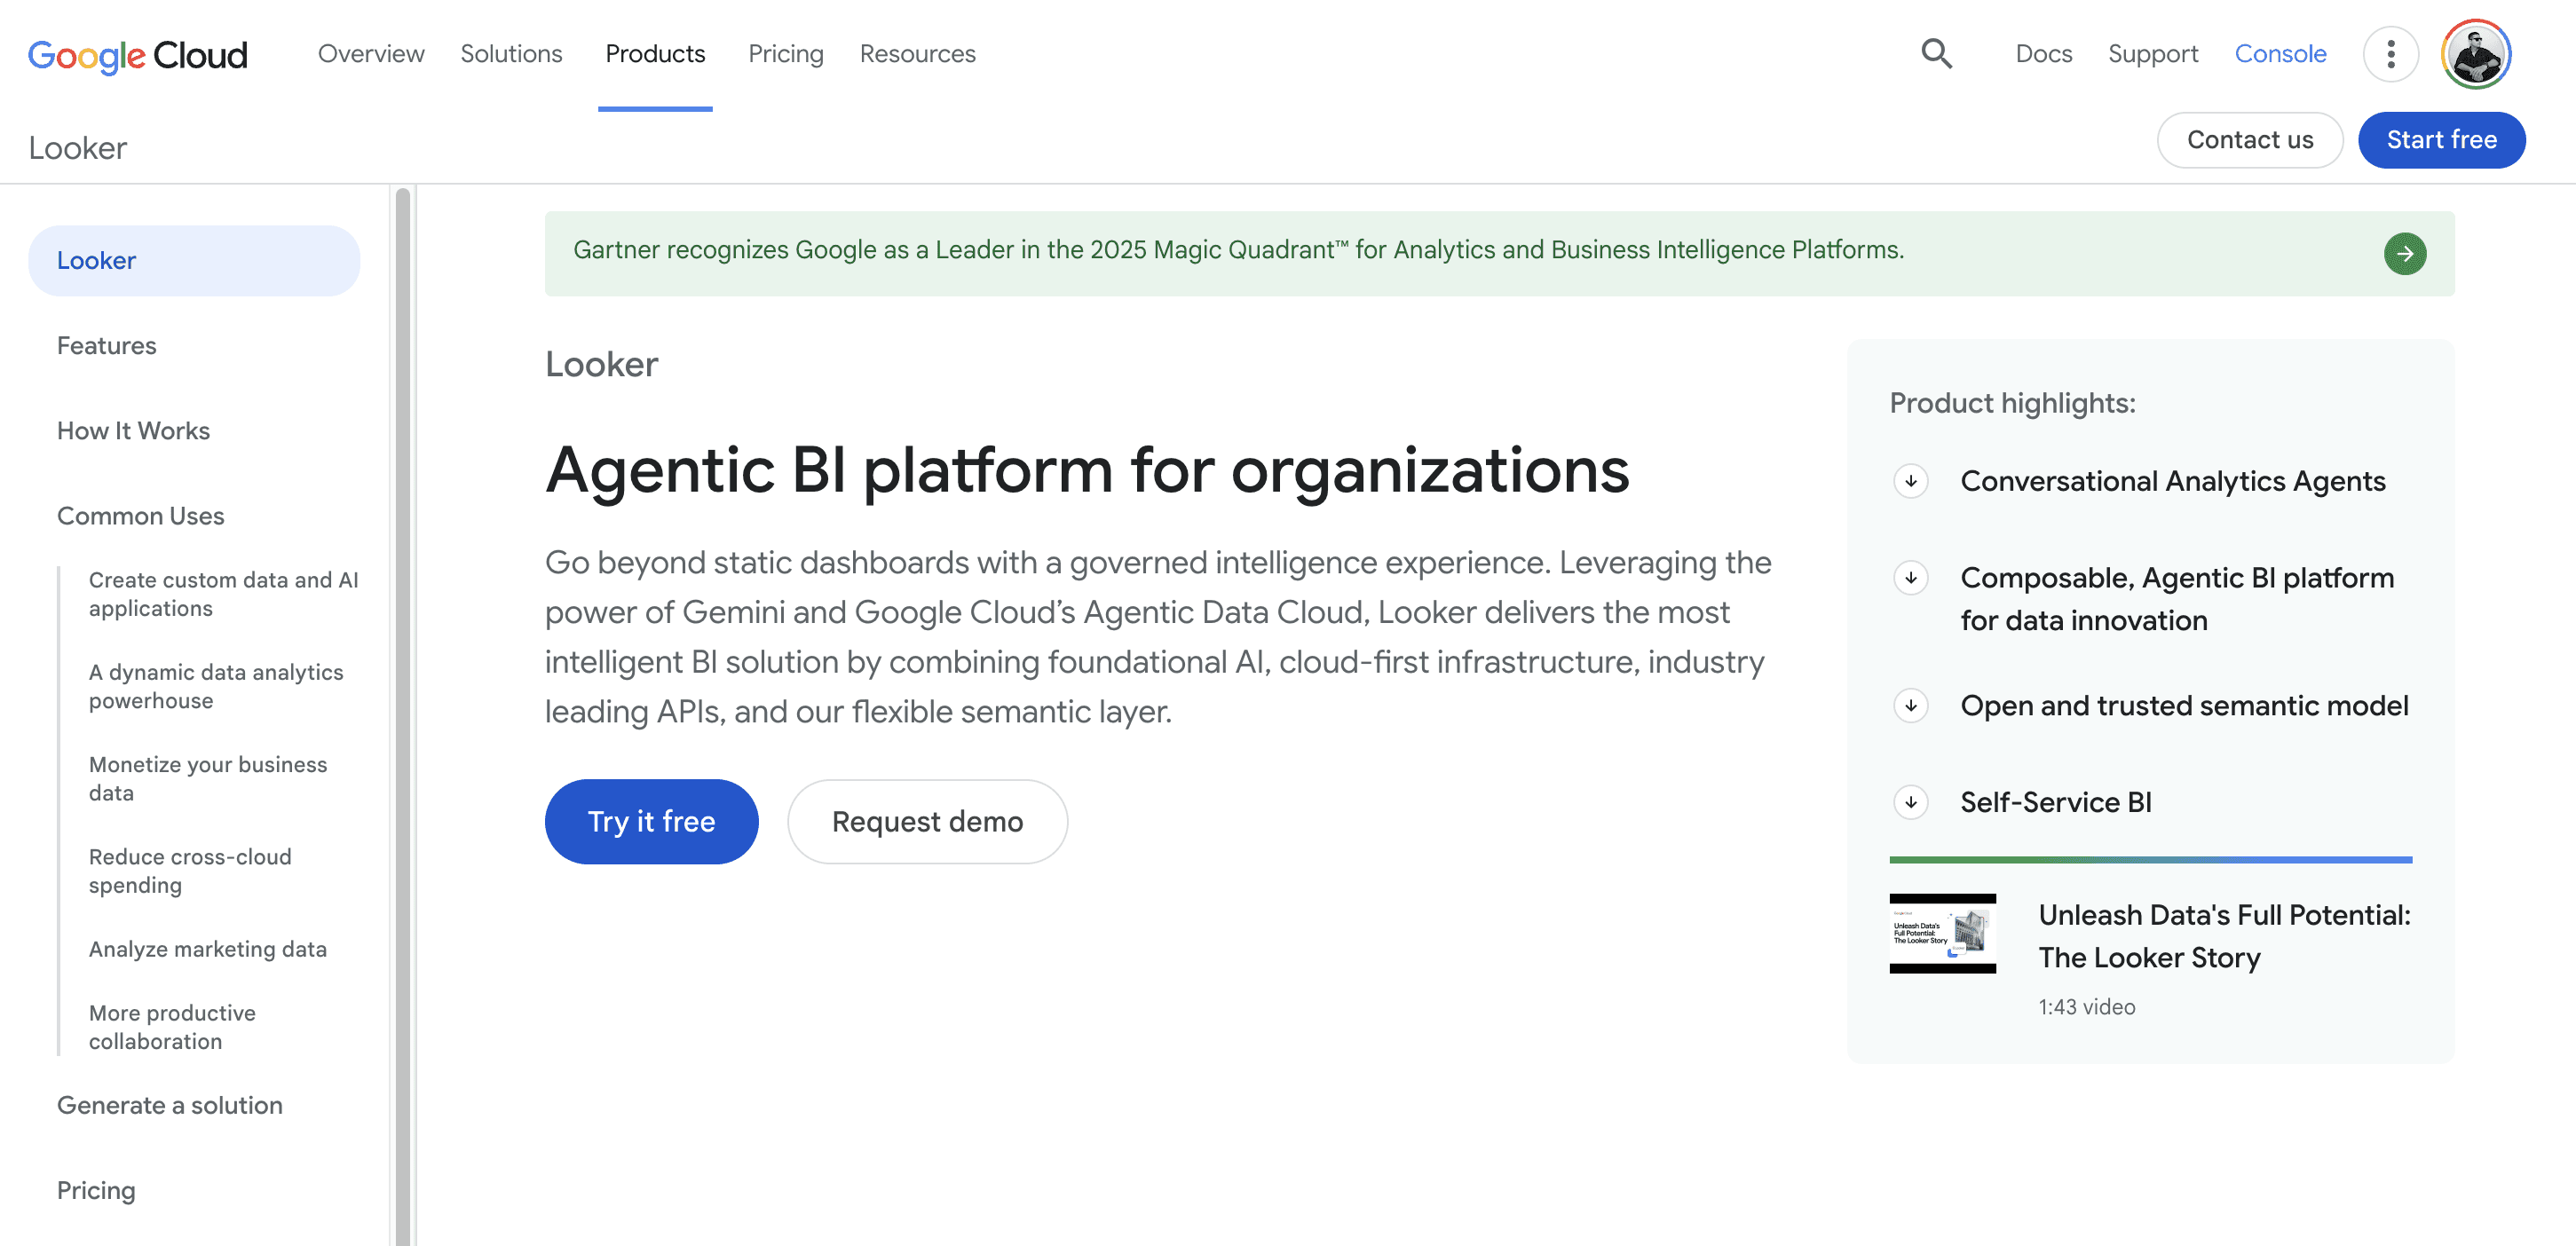
What it does: A BI platform on LookML, a code-defined semantic model, strong for governed metrics and embedded BI.
Who it's for: Retailers on Google Cloud, or embedding governed analytics into apps.
Key feature: LookML, a version-controlled semantic modeling layer.
Pricing: Platform plus per-user; not fully public, contact sales.
Not a fit if: You lack engineering capacity for LookML, or need answers today.
6. Phocas: Retail-Specific BI Out of the Box

What it does: A BI platform with pre-built models for distribution and retail, for fast deployment on ERP and POS data.
Who it's for: Mid-market retailers and distributors wanting retail-ready BI without a long project.
Key feature: Pre-built retail and distribution data models.
Pricing: Not public; contact sales.
Not a fit if: You need advanced custom visualisation or a conversational layer beyond templates.
7. Sisense: Embedded Retail Analytics
What it does: A BI platform focused on embedding analytics into applications, API-first.
Who it's for: Retailers embedding dashboards into apps for franchisees or customers.
Key feature: API-first, embeddable analytics.
Pricing: Not public; contact sales.
Not a fit if: Your need is internal operator reporting rather than embedded, customer-facing analytics.
Also worth evaluating: MicroStrategy (enterprise governed reporting) and Hex (notebook analytics). See best retail analytics software and best AI retail analytics platforms.
How Do the Top Retail BI Tools Handle Real Retail Jobs?
General BI tools can build almost anything with enough modeling; the question is what they do out of the box for retail.
Tool | Markdown / aging stock | Store-door performance | Demand forecast & replenish | Cross-channel customer LTV | Promo & margin |
|---|---|---|---|---|---|
Genloop | Via NL | Via NL | Via NL | Via NL | Via NL |
Power BI | Via modeling | Via modeling | Via modeling | Via modeling | Via modeling |
Tableau | Via modeling | Via modeling | Via modeling | Via modeling | Via modeling |
Qlik | Via modeling | Via modeling | Via modeling | Via modeling | Via modeling |
Looker | Via modeling | Via modeling | Via modeling | Via modeling | Via modeling |
Phocas | Native | Native | Native | Via modeling | Native |
Sisense | Via modeling | Via modeling | Via modeling | Via modeling | Via modeling |
Retail jobs-to-be-done by tool. Source: Genloop analysis of vendor documentation, June 2026.
Orientation: Who It's For, What It Connects To
Tool | Who it's for | Retail data sources | Natural-language access | Pricing |
|---|---|---|---|---|
Genloop | Store-ops, DM, COO | POS, labor, inventory (live) | Native, governed | Free tier, no per-seat |
Power BI | Analysts in Microsoft shops | POS/ERP via connectors | Copilot add-on | Lowest per-user |
Tableau | Analyst / BI teams | Warehouse, extracts | Pulse / Ask Data | Per-user |
Qlik | Analysts, exploratory | Warehouse, in-memory | Insight Advisor NLQ | Subscription |
Looker | Google Cloud, embedded | Warehouse via LookML | Modeled, limited NLQ | Platform + per-user |
Phocas | Merchandisers, distributors | ERP, POS (templated) | Limited | Custom |
Sisense | Product / franchise teams | API, embedded sources | Via embed | Custom |
What Are Common Retail BI Mistakes to Avoid?
Buying generic BI and expecting retail models. Most tools need an analyst to build markdown, sell-through, or store-comparison logic; only retail-native tools ship it.
Per-seat pricing that does not scale to store managers. A 30-store rollout under per-seat licensing gets expensive fast.
Dashboards no operator opens. If managers will not log in, a pushed brief beats another dashboard.
No single source of truth for definitions. Without a governed semantic layer, "conversion" or "comp sales" drifts between reports.
How Do You Choose the Right Retail BI Tool?
Four questions narrow the field fast. First, who consumes the numbers? If analysts build and read reports, a visualisation-first tool fits; if store and district managers need answers directly, prioritise search or conversational access. Second, is there a governed single source of truth? A semantic model that fixes metric definitions, whether LookML or a context graph, prevents the conflicting-numbers problem across stores. Third, can access be scoped by store? Row-level security is a control that filters each row of data by who is viewing it, so a manager sees only their store and a district manager only their district. It is non-negotiable once reports reach the field. Fourth, what does it cost across many users? Per-seat pricing scales poorly across dozens of store managers.
The rule of thumb is simple: if analysts consume the data, choose a visualisation-first BI tool such as Tableau, Qlik, or Power BI; if the store and district managers who run the business need the answers directly, choose an accuracy-first conversational layer. On that second job, Genloop is the clearest fit here, delivering governed answers over live retail data without an analyst in the loop. Start free on Genloop, no credit card required, or read what agentic analytics actually needs and traditional BI vs conversational analytics.
Frequently Asked Questions
What is the best retail BI tool in 2026?
It depends on who needs the answers. For non-analyst operators who want accurate conversational answers without building dashboards, Genloop leads. For analyst-built visualisation, Tableau; for Microsoft-native cost, Power BI; for retail-ready models, Phocas.
What is the difference between retail BI and retail analytics software?
Retail BI tools focus on dashboards, reporting, and visualisation, usually built by an analyst. Retail analytics software is broader, often including forecasting, merchandising, and operational delivery.
What is the difference between retail BI and a dashboard?
A dashboard is one output of a BI tool, a fixed view of chosen metrics. Retail BI is the wider system that connects data, governs definitions, and produces dashboards, reports, and answers.
Can retail BI tools give non-technical store managers answers?
Traditionally no, because classic BI assumes an analyst builds reports others consume. Self-service tools like Yellowfin and conversational layers like Genloop let non-technical managers ask directly.
How much do retail BI tools cost?
Published per-user pricing ranges from about $14/user/mo (Power BI Pro) to about $75/user/mo (Tableau Creator) as of mid-2026. Phocas, Sisense, Looker, and Yellowfin are quote-based. Genloop offers a free tier with no per-seat charges.
Which retail BI tool is best for franchises?
For franchise reporting, prioritise per-store access control and embedded delivery. Sisense suits embedding dashboards for franchisees; Genloop suits sending each franchisee a brief for only their own stores.
Do I need to replace my existing BI tool to add conversational analytics?
No. Conversational analytics typically sits alongside your BI tool. Genloop queries live data in place, so you keep existing dashboards for analysts while giving operators natural-language answers.